Episode Details
Back to Episodes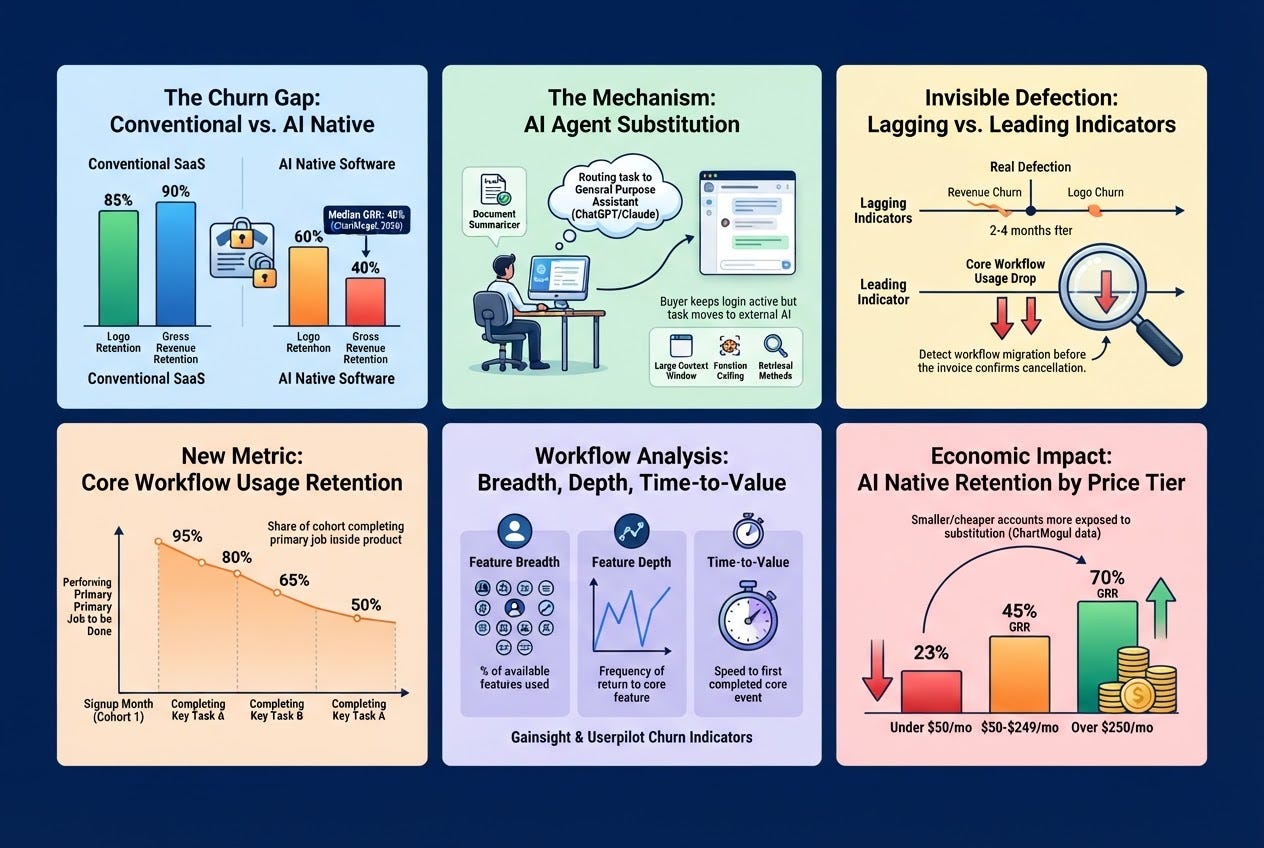
ChartMogul Finds the Churn Metric Teams Are Missing
Description
ChartMogul’s December 2025 SaaS Retention Report found that artificial intelligence native software retains revenue at a median gross rate of only 40 percent. A company in that category can still show a net revenue retention of 48 percent and look stable on paper, because the accounts that stopped using the product did not cancel, they simply stopped expanding while someone kept the login active. The gap between those two numbers is not a product quality problem in the ordinary sense. It is a measurement problem, and most product led growth teams are still tracking the wrong pair of figures.
ChartMogul’s analyst in residence, Kyle Poyar, built the finding from a dataset of 3,500 companies: 2,700 conventional business to business software providers, 600 consumer software providers, and 200 companies built around a generative or agentic model as the core interface. Within that last group, price tier explained more of the variance than anything else. Products priced above $250 a month held 70 percent gross revenue retention. Products priced under $50 a month held 23 percent. A 47 point spread, inside a single category of software, sorted almost entirely by how cheap and how narrow the job was that the product automated.
That spread is the fingerprint of substitution by a general purpose assistant. A product that summarizes a document, drafts a short email, or cleans up a spreadsheet formula is performing a task ChatGPT or Claude already does by default, for a price the customer may already be paying for something else entirely. A product that reconciles a general ledger against a payment processor and a state tax filing is performing a task those same assistants cannot do without someone building and maintaining the integration, the error handling, and the audit trail around it. Three engineering developments made the first category vulnerable to that substitution over the past eighteen months: context windows large enough to hold a whole task’s instructions in one session, function calling that lets a model execute steps rather than only describe them, and a token price that several providers cut by more than half between January and September of 2025. None of that shows up in a logo churn report or a revenue churn report, because both are recorded at the moment a contract ends, which can be eleven months after the customer actually stopped relying on the product for its original job.
The metric a product led growth team should add is core workflow usage retention: the share of a cohort still completing the specific task the product was bought to automate, each month, measured at the level of that task rather than at the level of a login. Gainsight’s 2026 customer success research describes tracking feature adoption on three dimensions, how many features an account uses, how often it returns to the core one, and how quickly a new account reaches its first completed task. Userpilot’s research names the failure mode a login count alone will miss: an account with high login activity and zero completed outcomes, the account most likely to be quietly routing its real work through a general purpose agent while someone on the team still opens the dashboard out of habit.
In thirty years of drafting and negotiating software agreements, I have redlined more usage based and outcome based pricing provisions into vendor contracts in the past year than in the previous five combined, almost always at the customer’s request rather than the vendor’s. That shift in who is asking for usage based pricing is itself a piece of evidence: a customer that wants to pay for outcomes rather than seats is a customer who already suspects, correctly in a growing number of cases, that it will not use every seat it is being asked to buy.
For a board or an investor, the practical consequence of ChartMogul’s data is that gross revenue retention and net revenue retention, reported at the company level, can both look adequate while