Episode Details
Back to Episodes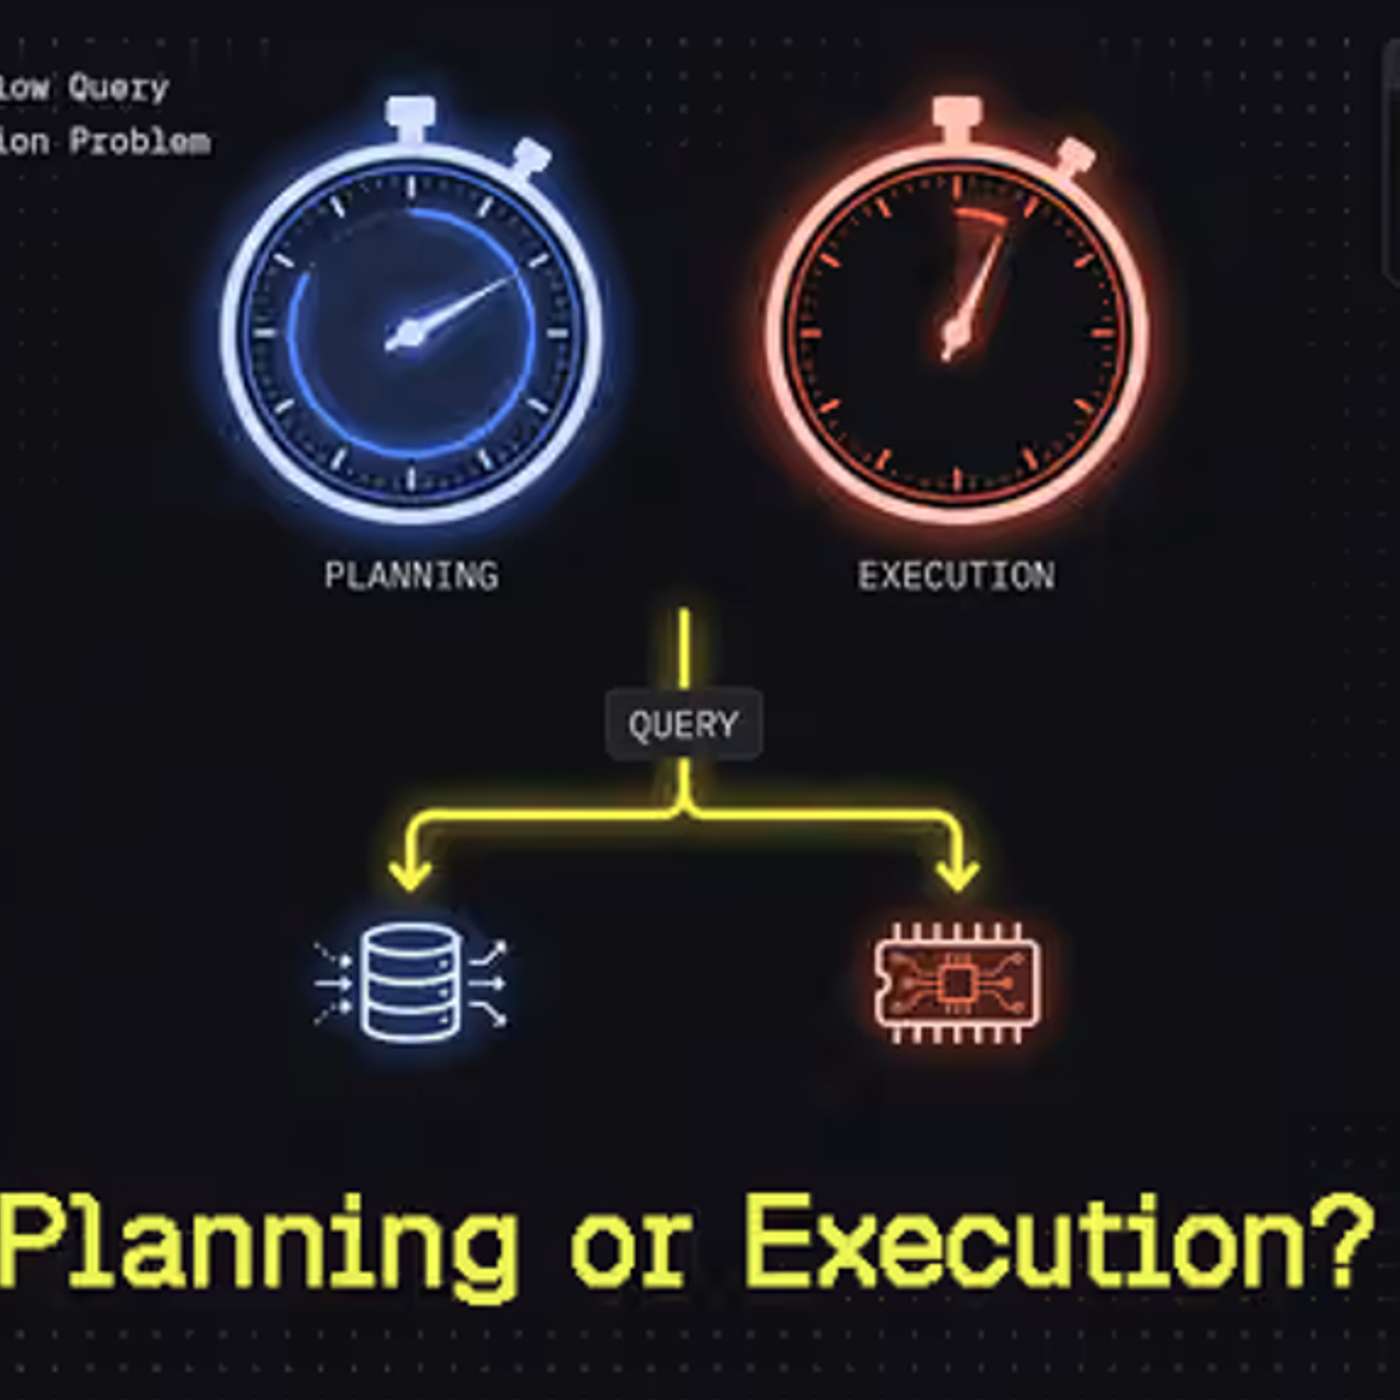
How to Tell Whether Your Slow Query Is a Planning or an Execution Problem
Description
This story was originally published on HackerNoon at: https://hackernoon.com/how-to-tell-whether-your-slow-query-is-a-planning-or-an-execution-problem.
Learn how to use PostgreSQL EXPLAIN ANALYZE to distinguish planning time from execution time and fix partition, memory, statistics, and caching bottlenecks.
Check more stories related to undefined at: https://hackernoon.com/c/undefined.
You can also check exclusive content about #postgresql-plan-caching, #postgresql-work_mem, #postgresql-extended-statistics, #postgresql-query-optimization, #postgresql-pg_stat_statements, #postgresql-query-performance, #postgresql-partition-pruning, #good-company, and more.
This story was written by: @tigerdata. Learn more about this writer by checking @tigerdata's about page,
and for more stories, please visit hackernoon.com.
PostgreSQL query latency has two clocks: Planning Time and Execution Time. When planning dominates, adding indexes may make performance worse by increasing planner work, especially across heavily partitioned tables. When execution dominates, buffer reads, hash spills, filtering, and storage layout become the targets. This guide uses real PostgreSQL 16.13 plans to show how to identify each bottleneck, fix bad estimates with extended statistics, reduce planning overhead with plan caching and partition design, and recognize when a PostgreSQL-first architecture such as Tiger Data can address the problem at the source.