Episode Details
Back to Episodes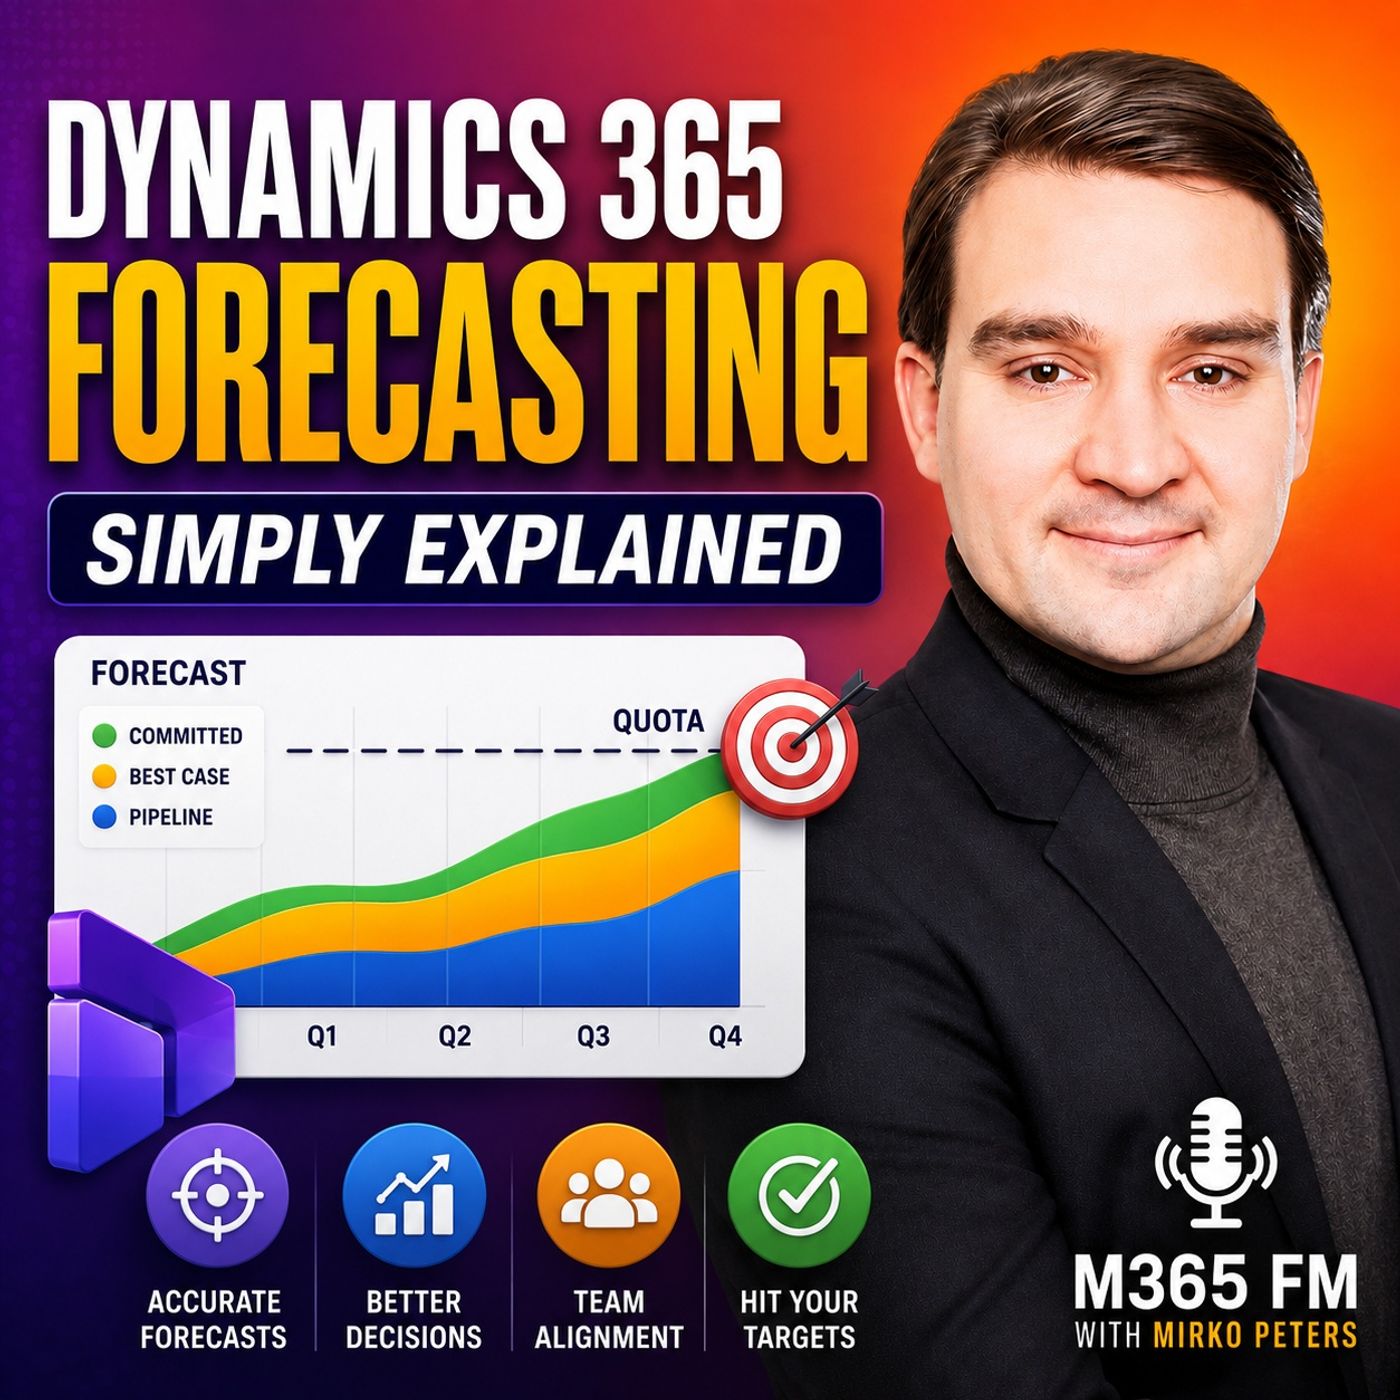
Dynamics 365 Forecasting - Simply Explained
Season 3
Published 2 months, 2 weeks ago
Description
Dynamics 365 Forecasting helps sales teams answer one of the most important questions in business: are we going to hit our sales target? Instead of collecting numbers from spreadsheets, emails, and individual sales reports, Dynamics 365 Sales brings opportunities, expected revenue, close dates, forecast categories, quotas, and sales performance into one shared forecasting view. In this episode of M365 FM, Mirko Peters explains how Dynamics 365 Forecasting works, how forecast categories represent confidence, and why accurate opportunity data is essential for reliable revenue forecasting.
ㅤ
WHAT IS DYNAMICS 365 FORECASTING?
ㅤ
Dynamics 365 Forecasting turns the opportunities your sales team already manages in Dynamics 365 Sales into a structured view of expected revenue. A sales forecast isn't a guarantee of future revenue. It's a continuously changing estimate based on what the sales organization currently knows about its open opportunities.
The forecast combines important information including expected deal value, expected close dates, sales quotas, ownership, and confidence. This allows sellers and sales managers to understand not only how much potential revenue exists, but how realistic that revenue is for the current forecasting period.
ㅤ
FROM SPREADSHEETS TO A SHARED SALES FORECAST
ㅤ
Traditional forecasting often depends on individual spreadsheets that sellers update at different times. Managers then collect those files, consolidate the numbers, and try to determine which version contains the latest information.
Dynamics 365 Sales changes this process by building forecasts from opportunity data already maintained by the sales organization. Instead of creating another reporting process, forecasting becomes part of everyday sales management. Everyone can work from the same underlying opportunity information.
ㅤ
UNDERSTANDING THE FORECAST GRID
ㅤ
The Dynamics 365 forecast grid acts like a shared sales scorecard. Depending on how forecasting is configured, rows can represent individual sellers, teams, territories, or products. Columns can show quota, forecast amounts, and different levels of forecast confidence.
Managers can move beyond headline revenue numbers and drill into the opportunities behind those totals. This makes forecast conversations more practical because teams can discuss specific deals, changes in close dates, customer decisions, and pipeline risks instead of debating spreadsheet numbers.
ㅤ
FORECAST CATEGORIES EXPLAINED
ㅤ
Forecast categories provide a common language for describing the confidence behind each opportunity. Pipeline represents opportunities that are still relatively early or uncertain. Best Case represents opportunities showing meaningful progress but which are not yet reliable enough to treat as expected revenue.
Committed represents opportunities where the customer has provided a strong verbal or contractual commitment, although the sale has not officially closed. Omitted removes an opportunity from forecast totals without deleting the opportunity from Dynamics 365 Sales.
Won and Lost are handled differently. When opportunities are formally closed, Dynamics 365 updates their final status accordingly. Together, these categories allow teams to see the difference between potential revenue, realistic upside, and high-confidence opportunities.
ㅤ
FORECASTING FOR SELLERS AND SALES MANAGERS
ㅤ
Different roles can use the same forecasting data for different decisions. Individual sellers can compare their current forecast against quota and identify where they need to focus their attention. A seller who has a large gap between expected revenue and target can determine whether existing opportunities need attention or whether additional pipeline must be created.
Sales managers can view the entire team and then drill into individual sellers and opportunities. This makes coaching more
ㅤ
WHAT IS DYNAMICS 365 FORECASTING?
ㅤ
Dynamics 365 Forecasting turns the opportunities your sales team already manages in Dynamics 365 Sales into a structured view of expected revenue. A sales forecast isn't a guarantee of future revenue. It's a continuously changing estimate based on what the sales organization currently knows about its open opportunities.
The forecast combines important information including expected deal value, expected close dates, sales quotas, ownership, and confidence. This allows sellers and sales managers to understand not only how much potential revenue exists, but how realistic that revenue is for the current forecasting period.
ㅤ
FROM SPREADSHEETS TO A SHARED SALES FORECAST
ㅤ
Traditional forecasting often depends on individual spreadsheets that sellers update at different times. Managers then collect those files, consolidate the numbers, and try to determine which version contains the latest information.
Dynamics 365 Sales changes this process by building forecasts from opportunity data already maintained by the sales organization. Instead of creating another reporting process, forecasting becomes part of everyday sales management. Everyone can work from the same underlying opportunity information.
ㅤ
UNDERSTANDING THE FORECAST GRID
ㅤ
The Dynamics 365 forecast grid acts like a shared sales scorecard. Depending on how forecasting is configured, rows can represent individual sellers, teams, territories, or products. Columns can show quota, forecast amounts, and different levels of forecast confidence.
Managers can move beyond headline revenue numbers and drill into the opportunities behind those totals. This makes forecast conversations more practical because teams can discuss specific deals, changes in close dates, customer decisions, and pipeline risks instead of debating spreadsheet numbers.
ㅤ
FORECAST CATEGORIES EXPLAINED
ㅤ
Forecast categories provide a common language for describing the confidence behind each opportunity. Pipeline represents opportunities that are still relatively early or uncertain. Best Case represents opportunities showing meaningful progress but which are not yet reliable enough to treat as expected revenue.
Committed represents opportunities where the customer has provided a strong verbal or contractual commitment, although the sale has not officially closed. Omitted removes an opportunity from forecast totals without deleting the opportunity from Dynamics 365 Sales.
Won and Lost are handled differently. When opportunities are formally closed, Dynamics 365 updates their final status accordingly. Together, these categories allow teams to see the difference between potential revenue, realistic upside, and high-confidence opportunities.
ㅤ
FORECASTING FOR SELLERS AND SALES MANAGERS
ㅤ
Different roles can use the same forecasting data for different decisions. Individual sellers can compare their current forecast against quota and identify where they need to focus their attention. A seller who has a large gap between expected revenue and target can determine whether existing opportunities need attention or whether additional pipeline must be created.
Sales managers can view the entire team and then drill into individual sellers and opportunities. This makes coaching more