Episode Details
Back to Episodes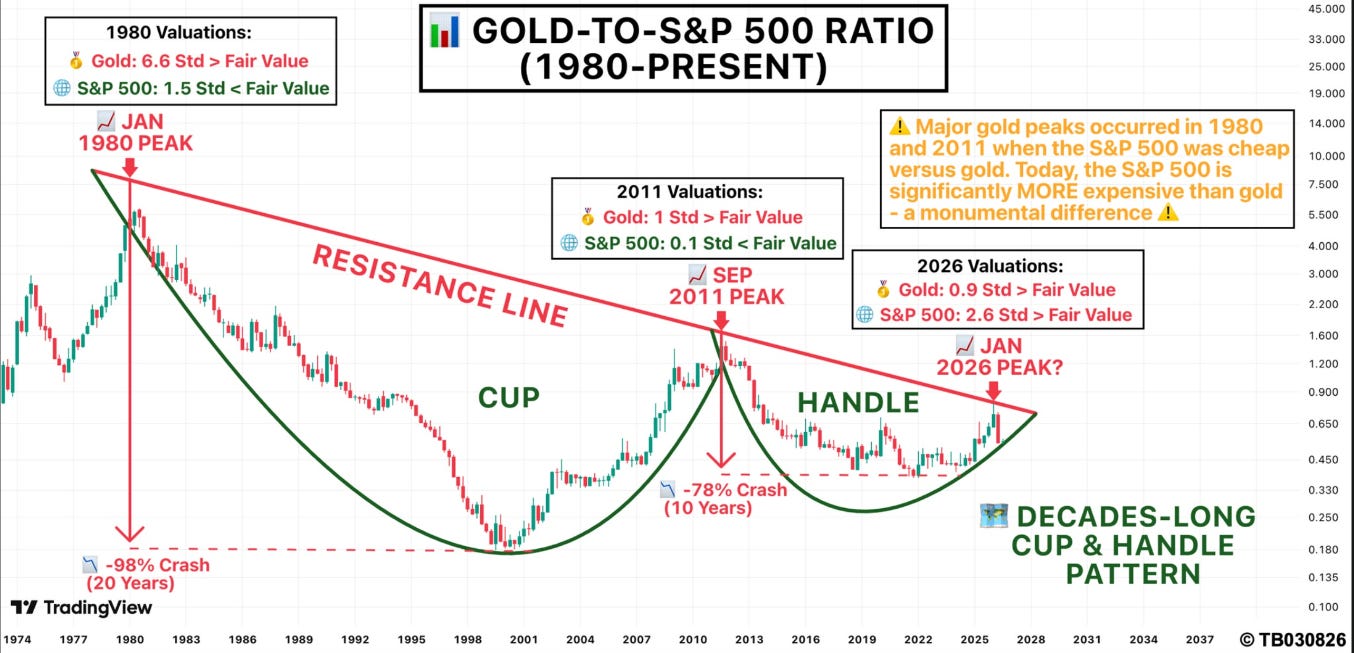
What the Gold to S&P 500 ratio is telling us RIGHT NOW!
Description
Welcome to Chart of the Month for August 2026 with The Contrarian Capitalist and Tom Bradshaw.
4 small bits of housekeeping
* This video was recorded on Saturday 15th August 2026 AM UK Time.
* None of this is to be constituted as investment or trading advice. We are NOT financial advisors.
* Please continue to provide feedback. Thank you, Vincent, for suggesting a bullet pointed summary of the transcript, which is below.
* Please subscribe to The Contrarian Capitalist and Tom Bradshaw using the buttons below.
Bullet Pointed Transcript via AI (for those that don’t have time to watch the full video)
* Gold-to-S&P ratio chart shows a long-term bullish cup-and-handle pattern since 1974.
* A major resistance line connects peaks from 1980, 2011, and 2026.
* Past hits to this line caused big pullbacks (98% then 78%); the next retest may break higher.
* Today the S&P is much more overvalued than gold (about 6 times more).
* Gold can outperform the S&P either by rising faster or by falling less in a market drop.
* Gold is still a bit expensive, so keeping some cash (in short-term Treasuries) is smart for flexibility.
* A breakout could be sharp and sudden, with gold possibly reaching $9,000 by late 2028.
* If you have no gold yet, consider starting a position even now.
* Cash or short-term bonds help you buy cheaper later if prices drop.
NB - None of this is to be constituted as investment or trading advice. We are NOT financial advisors.
This is a public episode. If you'd like to discuss this with other subscribers or get access to bonus episodes, visit contrariancapitalist.substack.com/subscribe