Episode Details
Back to Episodes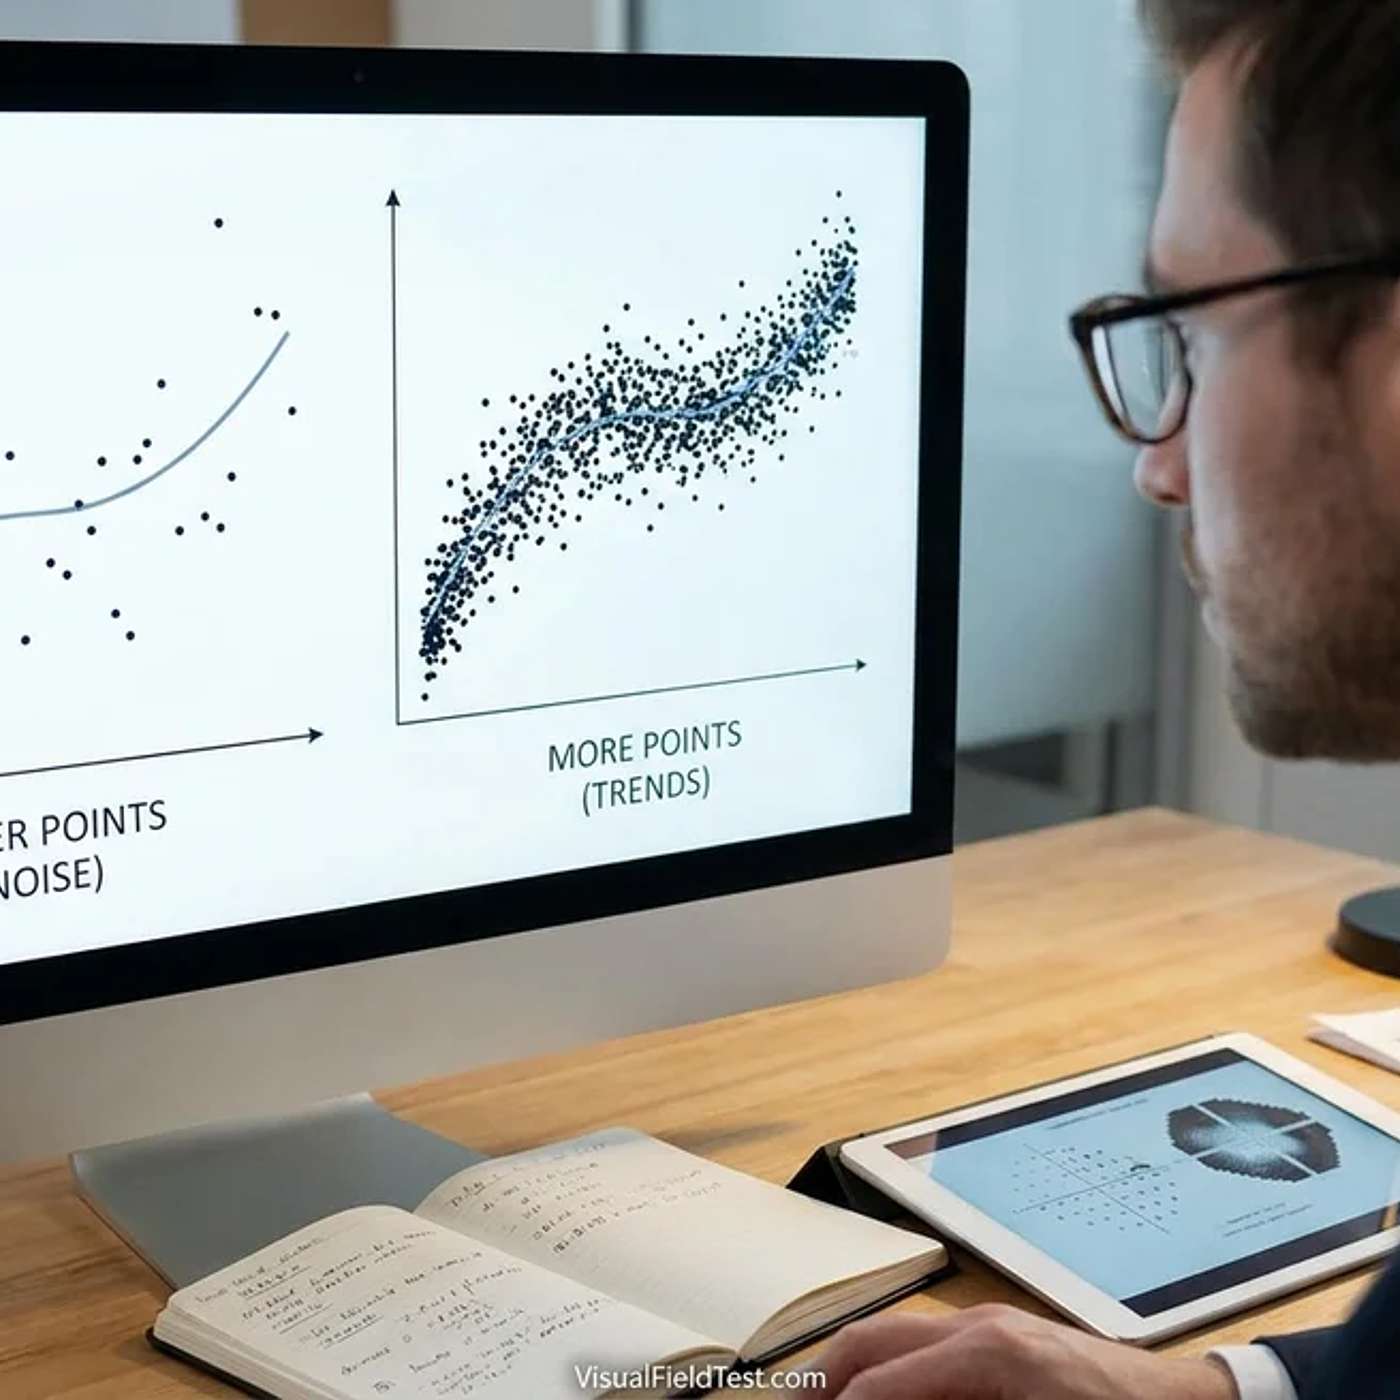
Do More Data Points Reveal Clearer Trends? Power and Noise in VF Progression
Description
This audio article is from VisualFieldTest.com.
Read the full article here: https://visualfieldtest.com/en/do-more-data-points-reveal-clearer-trends-power-and-noise-in-vf-progression
Test your visual field online: https://visualfieldtest.com
Support the show so new episodes keep coming: https://www.buzzsprout.com/2563091/support
Excerpt:
Do More Data Points Reveal Clearer Trends? Power and Noise in Visual Field Progression Introduction In glaucoma, visual field testing is used to determine whether vision is stable or gradually worsening. The challenge is that each test contains some noise. Attention, fatigue, learning, cataract, dry eye, fixation, and the patient’s underlying level of damage can all affect the result. Testing more often usually makes a true trend easier to recognize. However, the benefit is not proportional. Moving from one test per year to two often provides a meaningful gain. Moving from two to three tests per year may help, but the additional benefit is smaller. Testing too often can also create more apparent “changes” that later disappear, especially when statistical thresholds are applied repeatedly. The practical goal is therefore not to collect the largest possible number of visual fields. It is to collect enough high-quality tests, spaced appropriately, to detect clinically important progression without creating unnecessary burden or false alarms. Current glaucoma guidance supports at least annual testing for established glaucoma, with more frequent testing during the first two years after diagnosis or when the risk of rapid progression is high. () Why visual field progression is difficult to detect A visual field test measures light sensitivity at many locations. The result is not a direct photograph of the optic nerve. It is a behavioral measurement that depends on the patient noticing and responding to visual stimuli. A simple way to describe a visual field series is: > Observed result = true visual function + measurement noise The true glaucoma signal may be a gradual decline of only a fraction of a decibel per year, while the variation between individual tests can be several decibels at some locations. Test–retest variability tends to be greater in eyes with more advanced damage, lower sensitivity, peripheral defects, and certain defect patterns. () Mean deviation Mean deviation is a single summary number describing the overall visual field compared with an age-adjusted normal field. A negative number indicates loss; a more negative number indicates greater overall loss. Mean deviation is useful because it averages information across the field and is relatively easy to follow over time. A clinician can plot mean deviation against time and calculate a slope, such as: −0.3 decibels per year: slow change −1.0 decibel per year: moderate change −2.0 decibels per year: rapid change However, mean deviation can miss localized progression if the damaged area is small. It can also be influenced by diffuse factors such as cataract or other media opacity. () Pointwise slopes Pointwise linear regression evaluates each test location separately. It can show that a particular cluster of locations is worsening at, for example, −1.2 decibels per year. This approach can detect localized or paracentral progression that is diluted within a whole-field average. Its disadvantages are that individual locations are noisier than the overall mean, many locations are tested simultaneously, and the chance of at least one apparently significant result increases as more locations and more visits are examined. () How increasing test frequency improves signal-to-noise For a trend analysis, additional tests help in two ways: They provide mor