Episode Details
Back to Episodes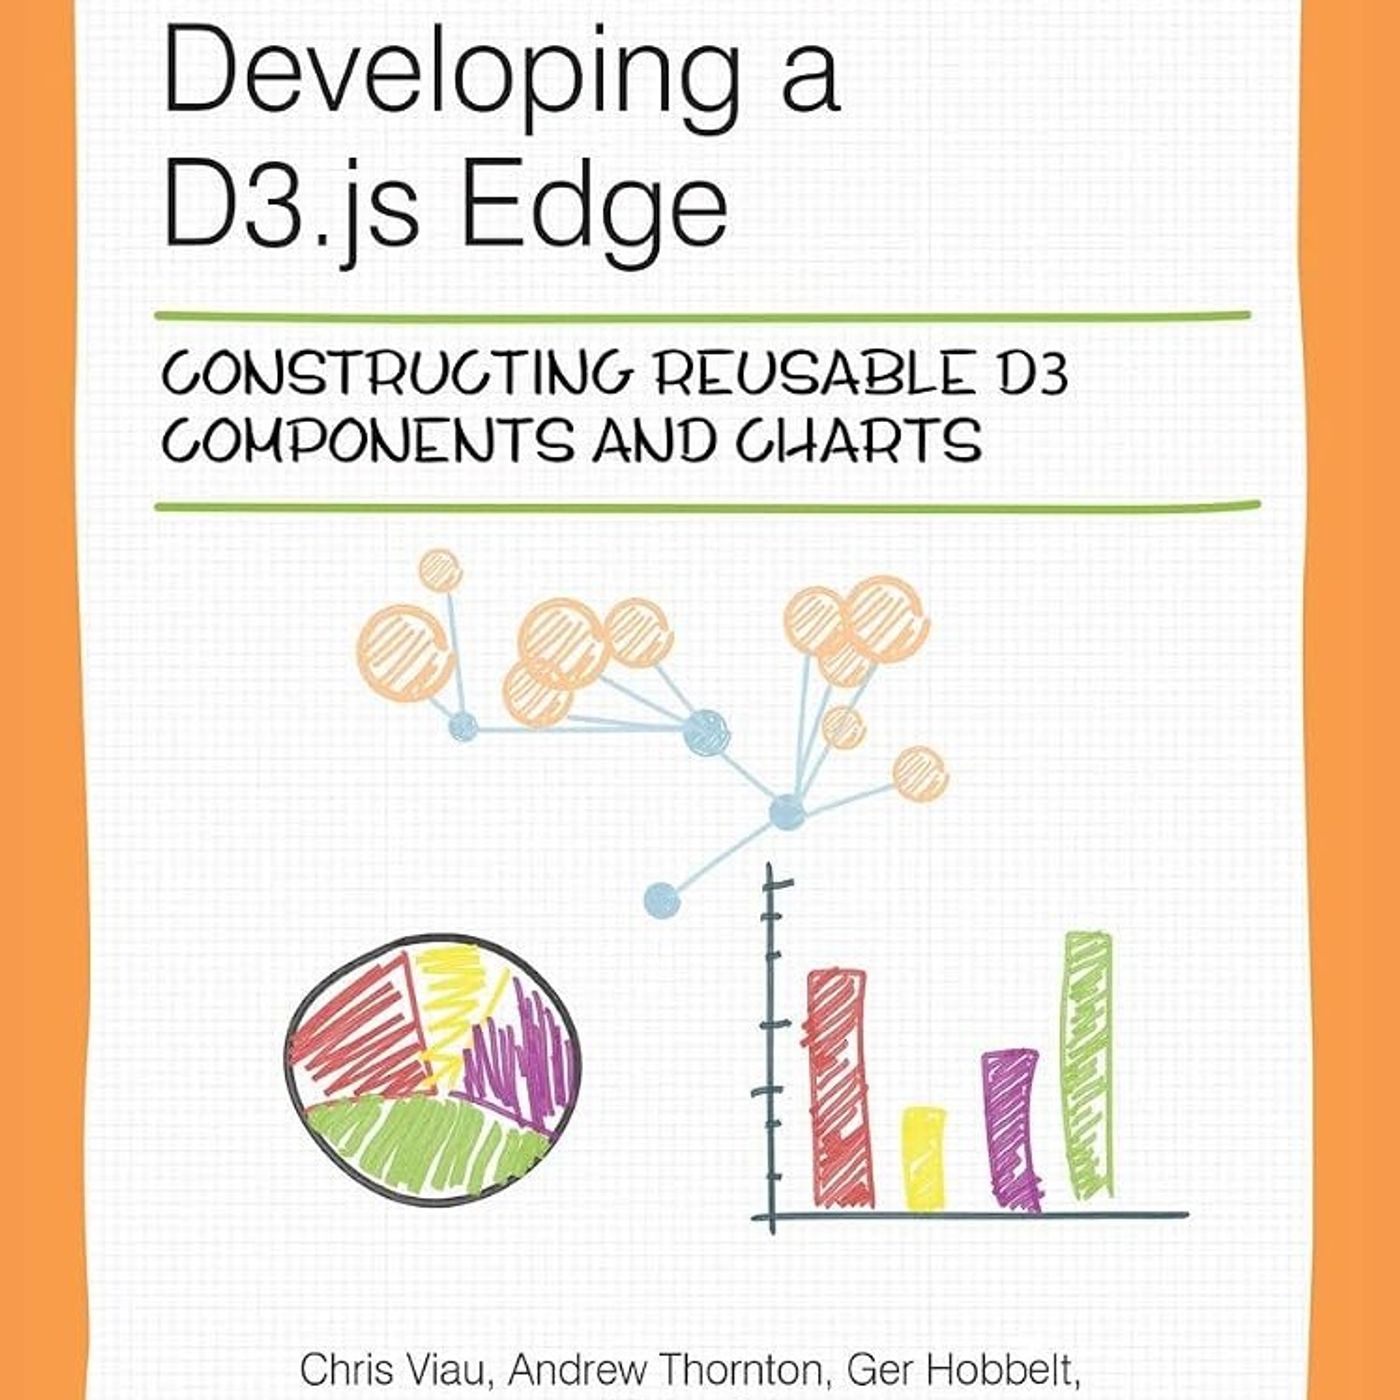
Developing A D3.Js Edge: Constructing Reusable D3 Components And Charts
Published 1 month, 3 weeks ago
Description
A technical guide authored by Chris Viau, Andrew Thornton, Ger Hobbelt, and Roland Dunn that focuses on building modular and reusable data visualizations. The text identifies a common problem where developers create "spaghetti code" that is difficult to maintain, suggesting instead a reusable API pattern introduced by D3 creator Mike Bostock. By utilizing closures, getters, and setters, the authors demonstrate how to encapsulate chart logic to create multiple independent visualization instances efficiently. The book provides a practical walkthrough of transitioning from standard D3 code to a plugin-based architecture, illustrated through examples like bar charts and radial histograms. Beyond graphics, the sources explain how to apply these modular principles to data management and unit testing using the Jasmine framework. Ultimately, the text serves as a roadmap for intermediate developers to create scalable, testable, and professional-grade web visualizations using real-world transit data.
You can listen and download our episodes for free on more than 10 different platforms:
https://linktr.ee/cyber_security_summary
Get the Book now from Amazon:
https://www.amazon.com/dp/9386052725?lv=shuf&channelId=500&plpRedirect=mhFallback&linkCode=ll2&tag=cvthunderx-20&linkId=53ef6b802f057258ad30df1b50ee6bfb&language=en_US&ref_=as_li_ss_tl
Discover our free courses in tech and cybersecurity, Start learning today:
https://linktr.ee/cybercode_academy
You can listen and download our episodes for free on more than 10 different platforms:
https://linktr.ee/cyber_security_summary
Get the Book now from Amazon:
https://www.amazon.com/dp/9386052725?lv=shuf&channelId=500&plpRedirect=mhFallback&linkCode=ll2&tag=cvthunderx-20&linkId=53ef6b802f057258ad30df1b50ee6bfb&language=en_US&ref_=as_li_ss_tl
Discover our free courses in tech and cybersecurity, Start learning today:
https://linktr.ee/cybercode_academy