Episode Details
Back to Episodes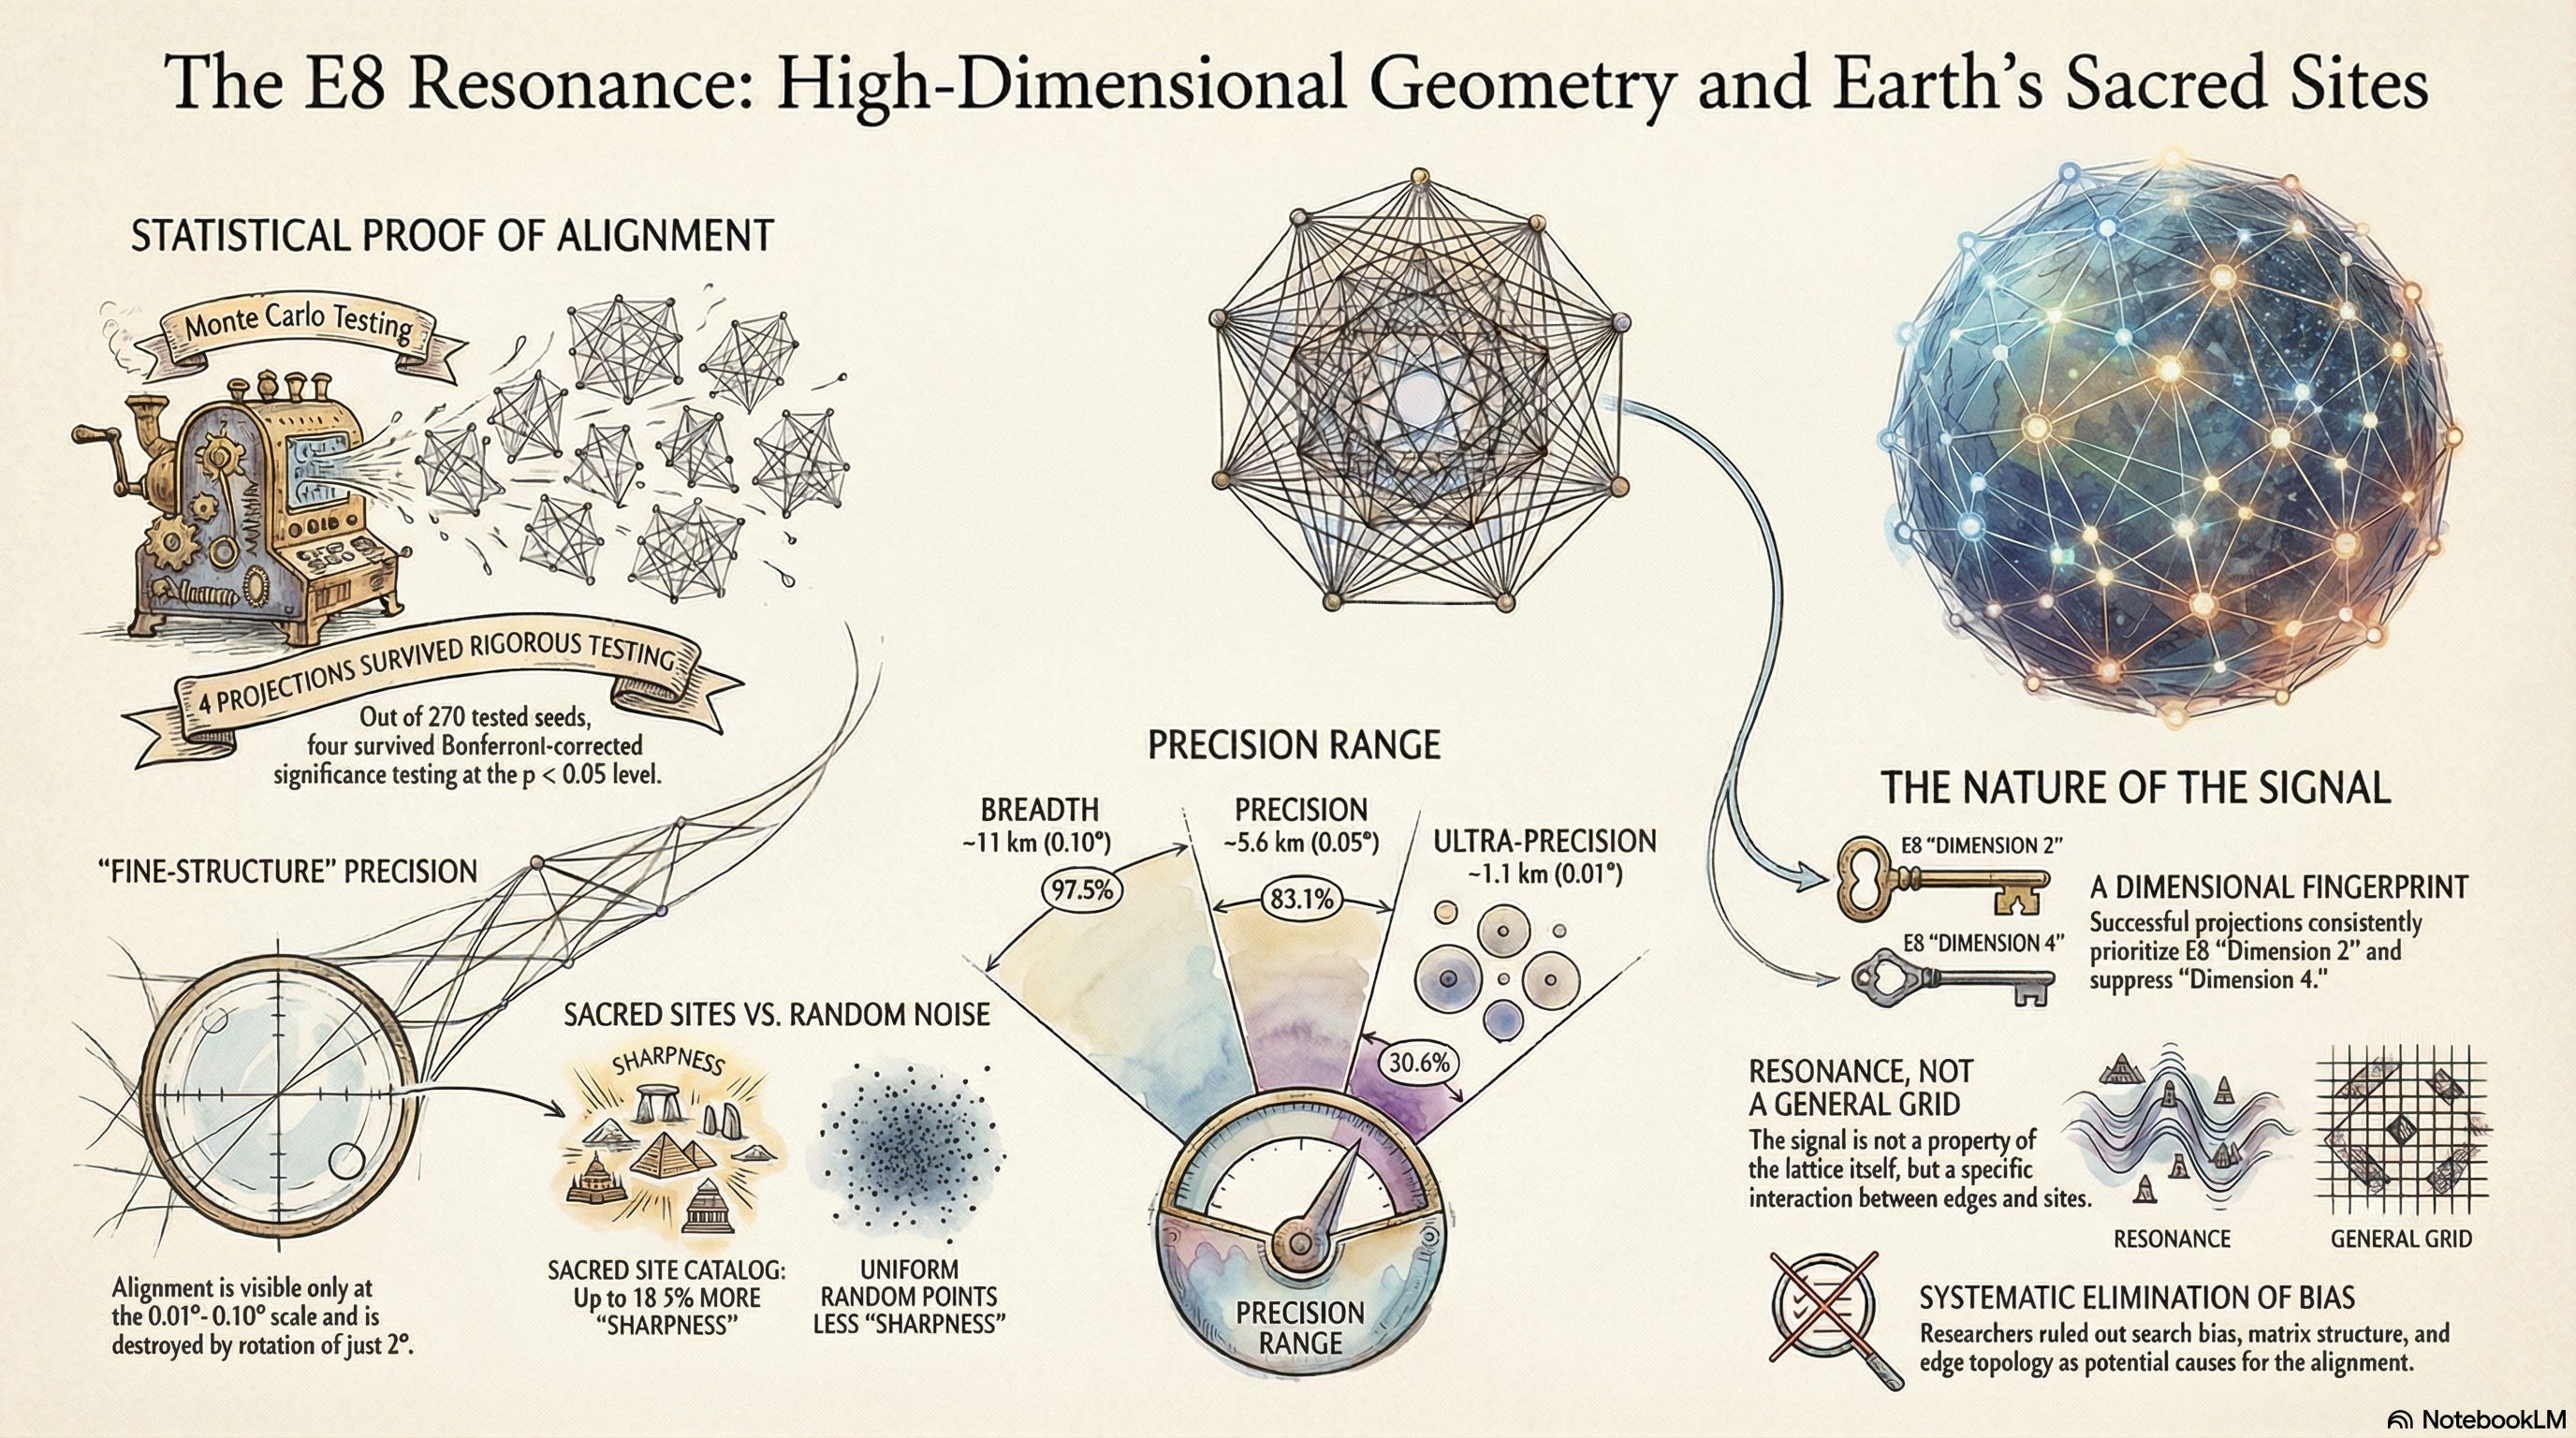
The Crystal, the Shadow, and the Wall
Description
This podcast (22min) was generated by NotebookLM to simplify complex scientific concepts into an accessible format — based entirely on my own research.
The research paper is published. The data is open. But a 26-page paper full of Monte Carlo trials and Bonferroni corrections isn’t for everyone. So I ran the paper through a long-form audio deep dive, a 22-minute conversation between two hosts who start sceptical and work their way through the evidence.
What came back surprised me. They found a way to explain this research that I hadn’t thought of myself.
The chandelier in the dark room
The hosts open with an image I wish I’d invented: imagine a crystal chandelier hanging in a pitch-black room. You shine a flashlight through it, casting its shadow onto the curved wall behind it. The shadow looks like chaos: a tangle of intersecting lines. But when you lean in closer, you notice the chaotic lines are perfectly intersecting with tiny pinpricks that someone had already drawn on the wall.
That feeling of impossible coincidence, they say, is the driving force behind the entire paper.
The chandelier is the E8 crystal, an eight-dimensional mathematical structure with 240 vertices and 6,720 edges. The flashlight is a projection matrix. The curved wall is the Earth. And the pinpricks are 160 sacred sites.
The Texas sharpshooter
The first thing the hosts confront is the obvious objection: isn’t this just pattern-matching after the fact? If you wrap 6,720 lines around a globe and let a computer rotate them, won’t you hit something by pure luck?
They walk through the Texas sharpshooter fallacy; the guy who shoots a barn full of holes and then paints the bullseye around the tightest cluster. Standard statistical tests, they explain, fall for exactly this illusion. Fixed-rotation null models are the statistician’s paint bucket.
The key insight they draw from the paper is the best-of-search null model: every Monte Carlo trial has the same freedom to optimise as the real data did. A thousand ghost tournaments, each one searching for its own best alignment. Only results that beat the best-optimised noise count.
They call this “giving the universe its own sharpshooter,” and note that four projections still survived.
The equalizer
The centrepiece of the conversation is an analogy that the hosts build around the dimensional fingerprint. They describe the eight dimensions of E8 as an eight-channel equalizer on a stereo. Each projection turns the volume up or down on each channel.
The discovery: every confirmed projection has the same settings. Channel 2 is boosted. Channel 4 is suppressed. Five out of five confirmed projections, across two different catalogs, share this pattern.
They then introduce Seed 166, the projection that almost worked but failed the statistical threshold, and show that it has the exact inverted settings. Channel 4 loud, channel 2 quiet. The inverted fingerprint.
One host calls this “the control experiment that nobody designed but the data delivered anyway.”
The invisible signal
Perhaps the most striking moment in the conversation comes when the hosts discuss the machine learning result. A Random Forest classifier, trained on 25 structural features of all 270 projections, achieved an AUC of 0.52; statistically indistinguishable from flipping a coin.
The AI saw nothing. The aggregate metrics saw nothing. The edge network topology showed no difference between confirmed and failed projections. Yet the signal is there; five projections out of 270, each producing alignment that a 2–3° rotation destroys.
“If you only look at the entire forest,” one host says, “you will confidently report that nothing special is happening. And you will completely miss the reality that five specific leaves on five specific trees are vibrating at the exact same invisible frequen