Episode Details
Back to Episodes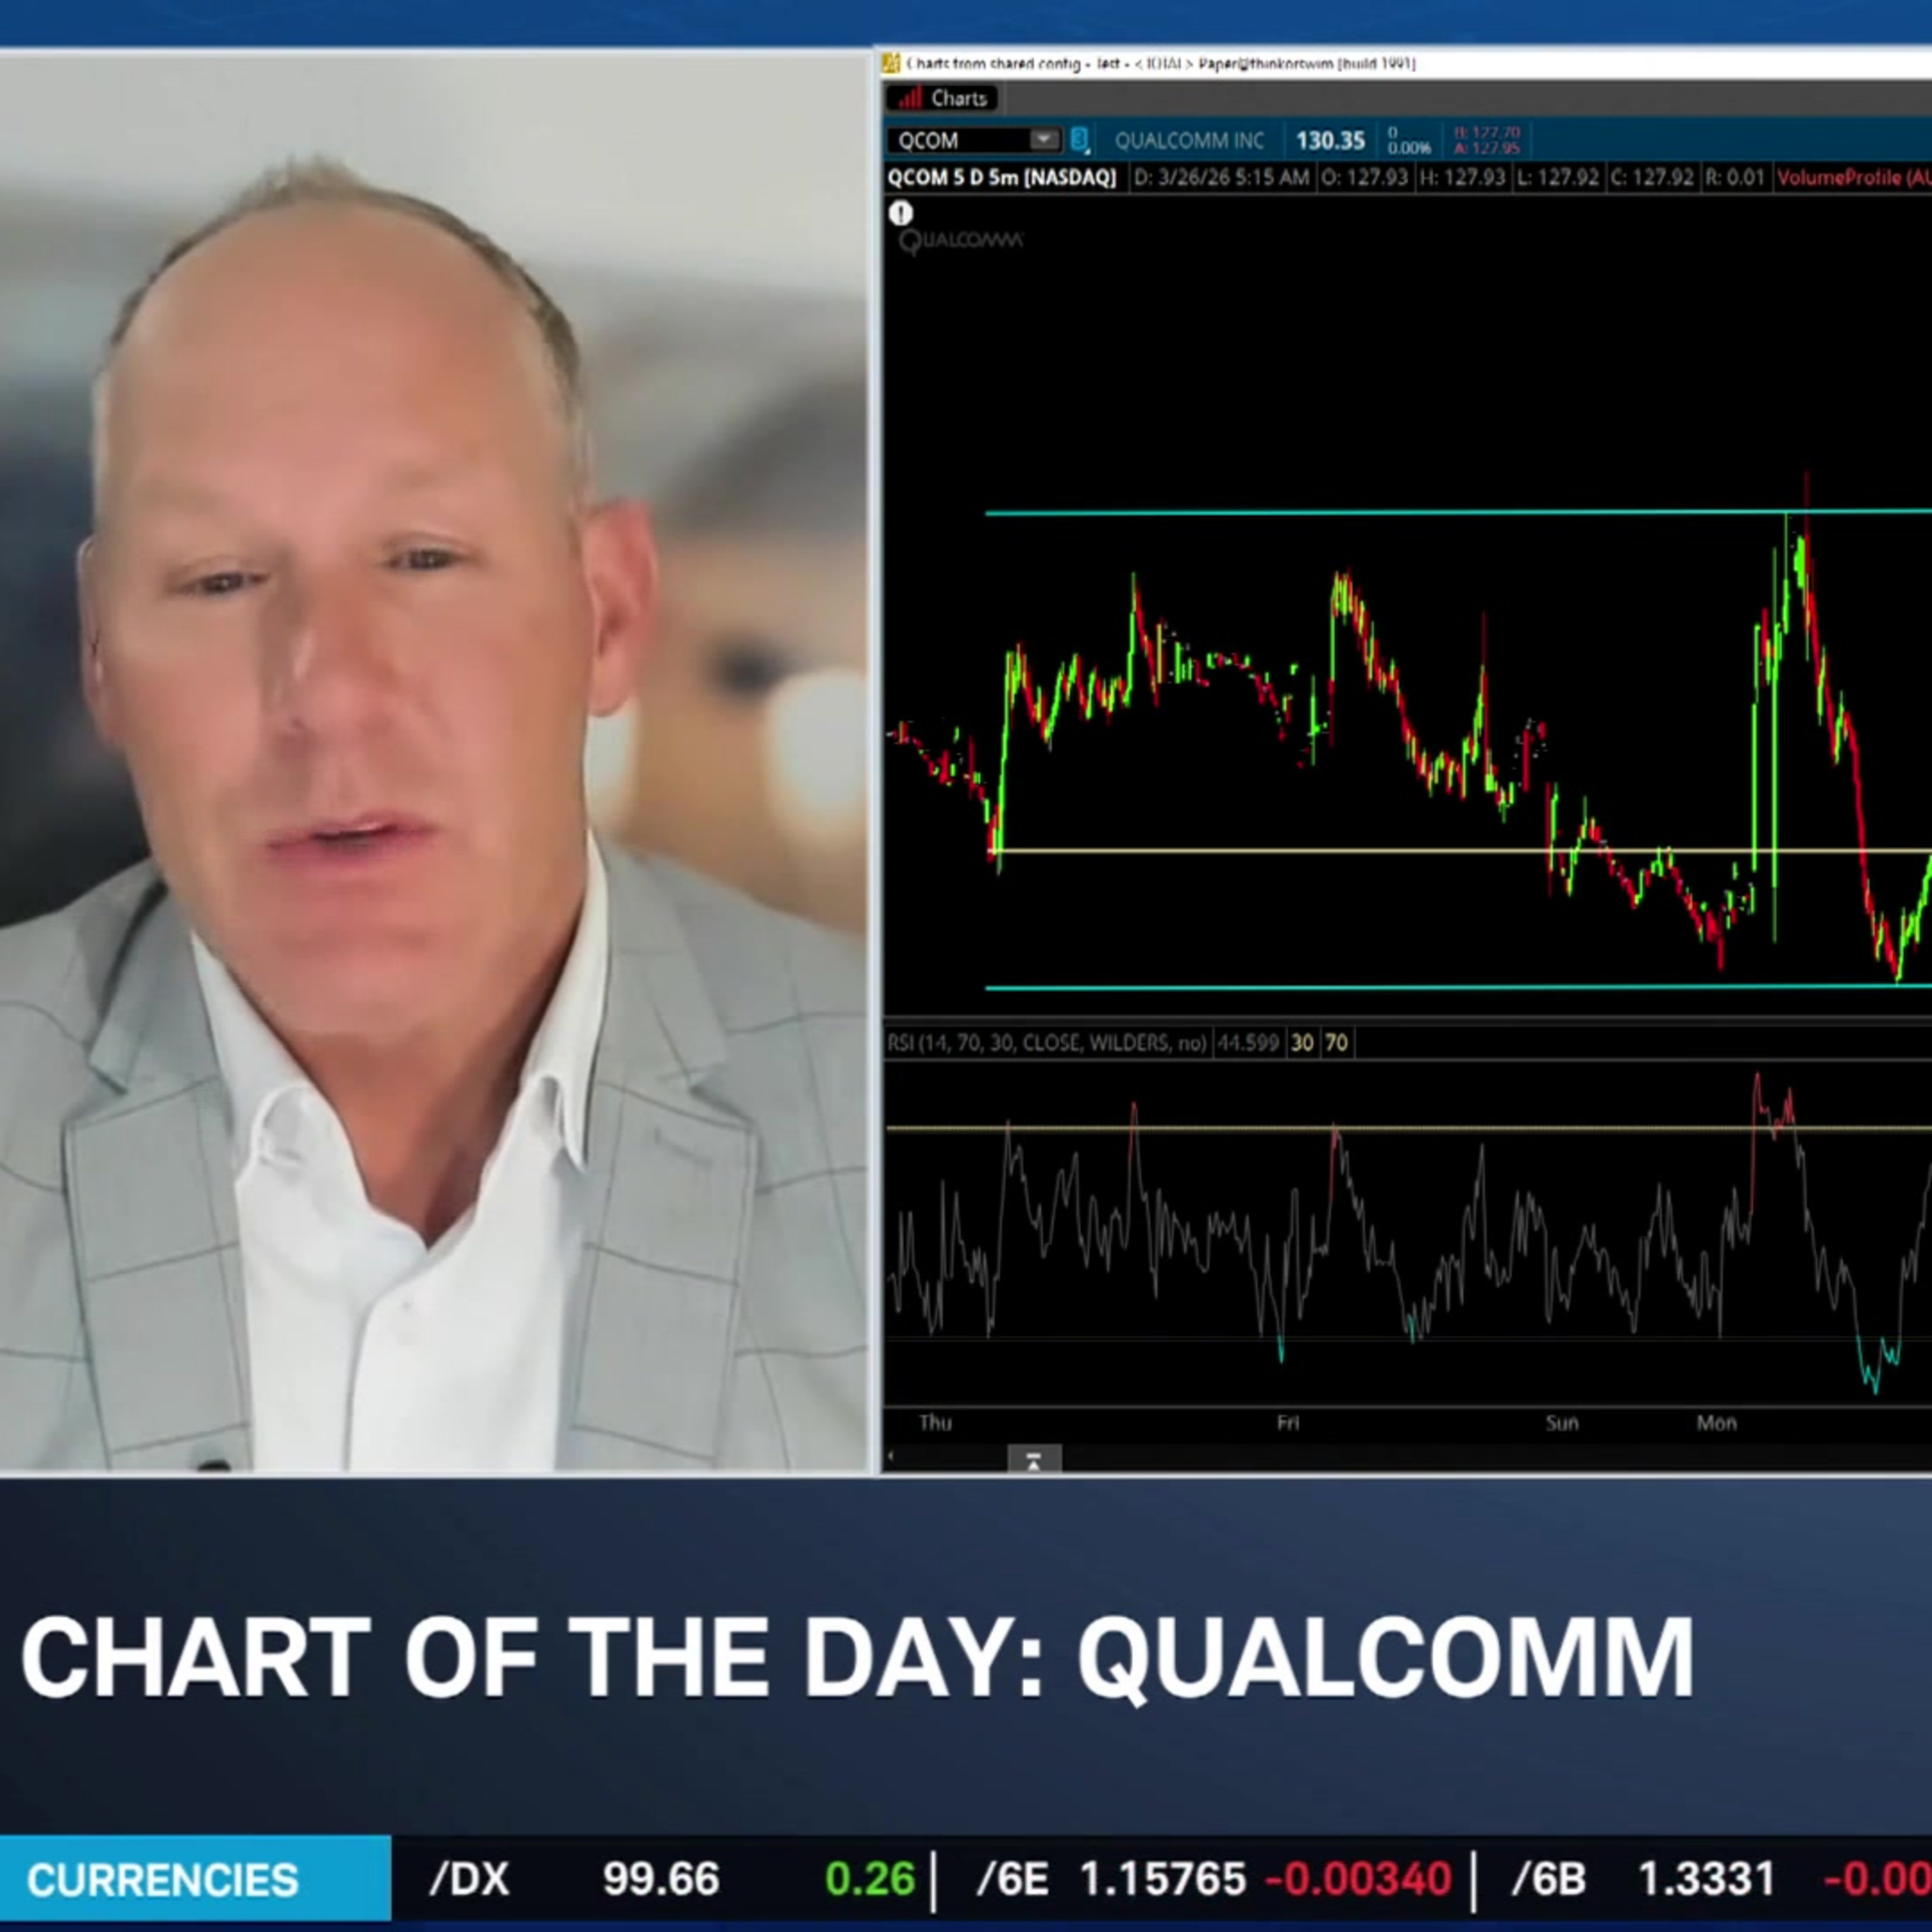
Chart of the Day: QCOM Price Action
Description
There's more to Qualcomm's (QCOM) 5-day trading activity than investors realize, says Charles Schwab's Brett Crowther. He highlights bullish indicators in the chart despite recent bearish price action. Brett then shows how it compares to Qualcomm's one-year chart and why shares can bounce off key technical support.
======== Schwab Network ========
Empowering every investor and trader, every market day.
Options involve risks and are not suitable for all investors. Before trading, read the Options Disclosure Document. http://bit.ly/2v9tH6D
Subscribe to the Market Minute newsletter - https://schwabnetwork.com/subscribe
Download the iOS app - https://apps.apple.com/us/app/schwab-network/id1460719185
Download the Amazon Fire Tv App - https://www.amazon.com/TD-Ameritrade-Network/dp/B07KRD76C7
Watch on Sling - https://watch.sling.com/1/asset/191928615bd8d47686f94682aefaa007/watch
Watch on Vizio - https://www.vizio.com/en/watchfreeplus-explore
Watch on DistroTV - https://www.distro.tv/live/schwab-network/
Follow us on X – https://twitter.com/schwabnetwork
Follow us on Facebook – https://www.facebook.com/schwabnetwork
Follow us on LinkedIn - https://www.linkedin.com/company/schwab-network/
About Schwab Network - https://schwabnetwork.com/about