Episode Details
Back to Episodes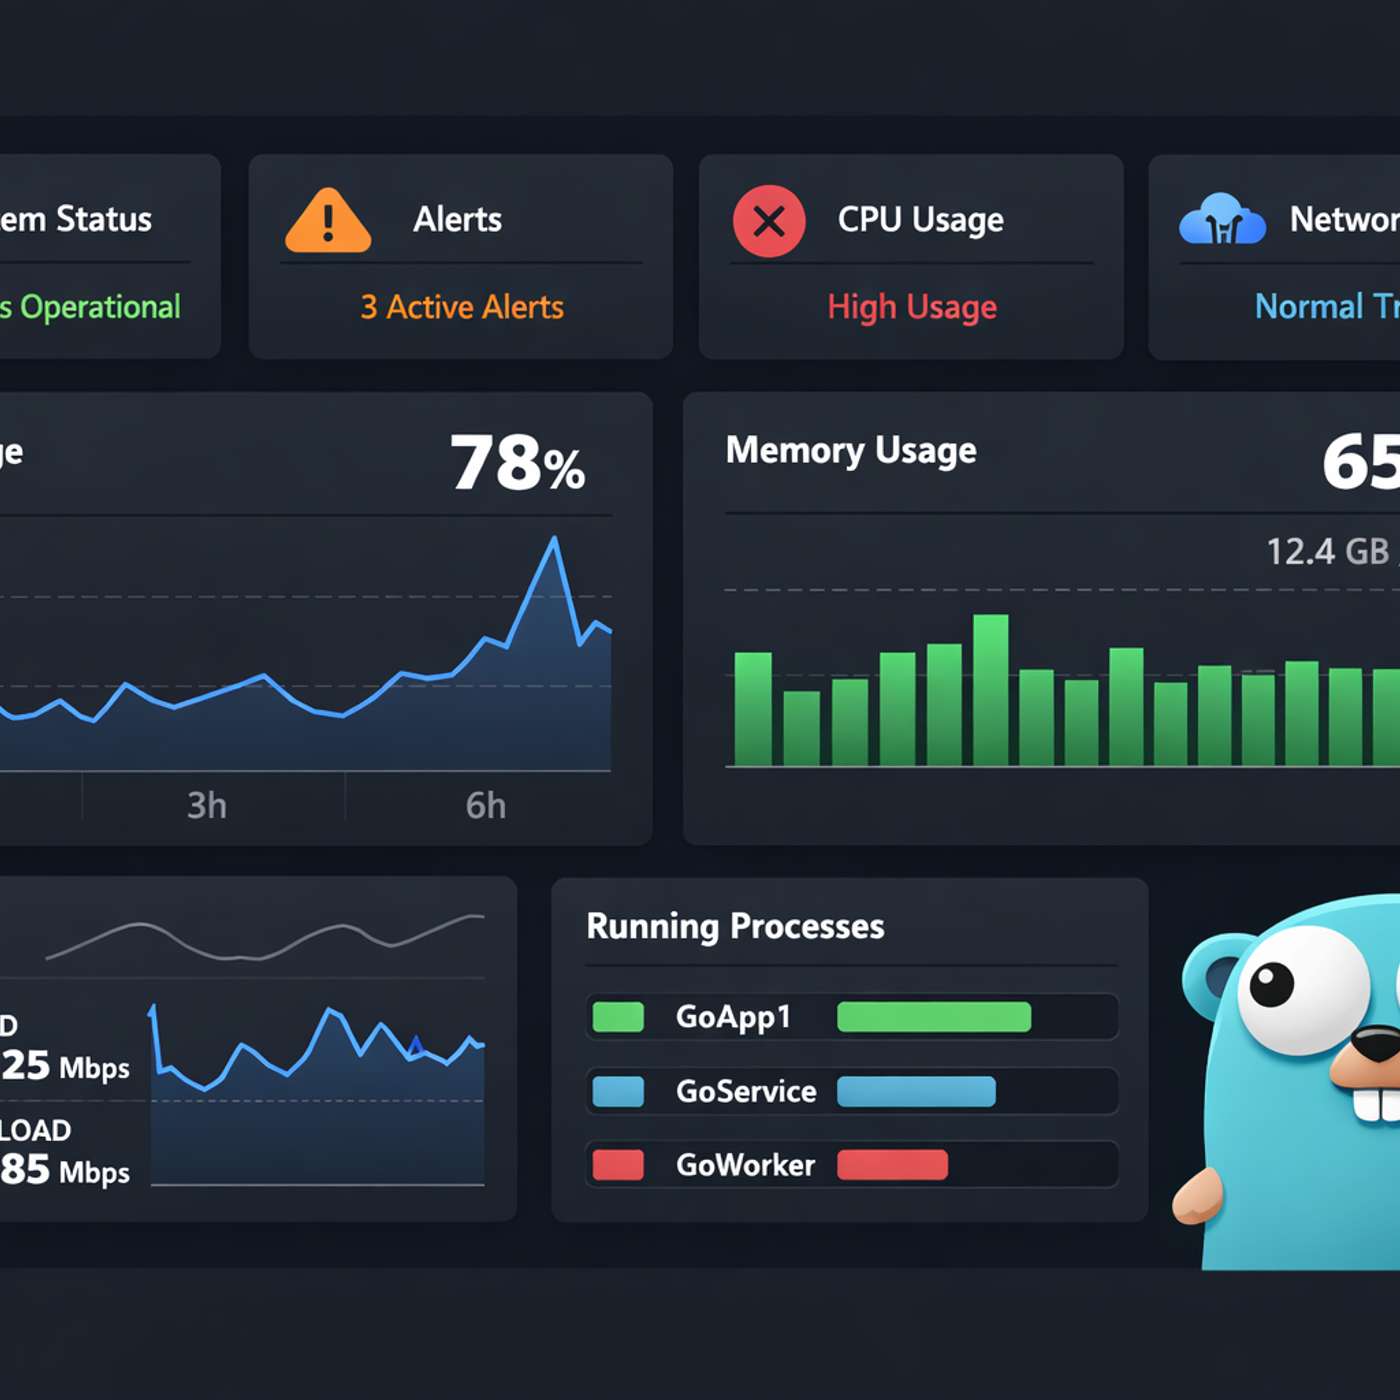
How to Build a Status Monitoring Service in Go
Description
This story was originally published on HackerNoon at: https://hackernoon.com/how-to-build-a-status-monitoring-service-in-go.
Build a Go-based monitoring app that probes services, opens/closes incidents, sends Teams/Slack alerts, and exports Prometheus metrics in Docker.
Check more stories related to programming at: https://hackernoon.com/c/programming.
You can also check exclusive content about #golang, #monitoring-microservices, #software-architecture, #go-monitoring-service, #prometheus-metrics, #docker-compose-monitoring, #postgresql-incident-tracking, #grafana-dashboards, and more.
This story was written by: @wole. Learn more about this writer by checking @wole's about page,
and for more stories, please visit hackernoon.com.
This tutorial walks through building StatusD, a self-hosted monitoring service in Go that reads monitored endpoints from JSON, probes them on schedules via a worker pool, records events and incidents in Postgres, sends Teams/Slack alerts, and exposes Prometheus metrics for Grafana dashboards—fully runnable with Docker Compose.