Episode Details
Back to Episodes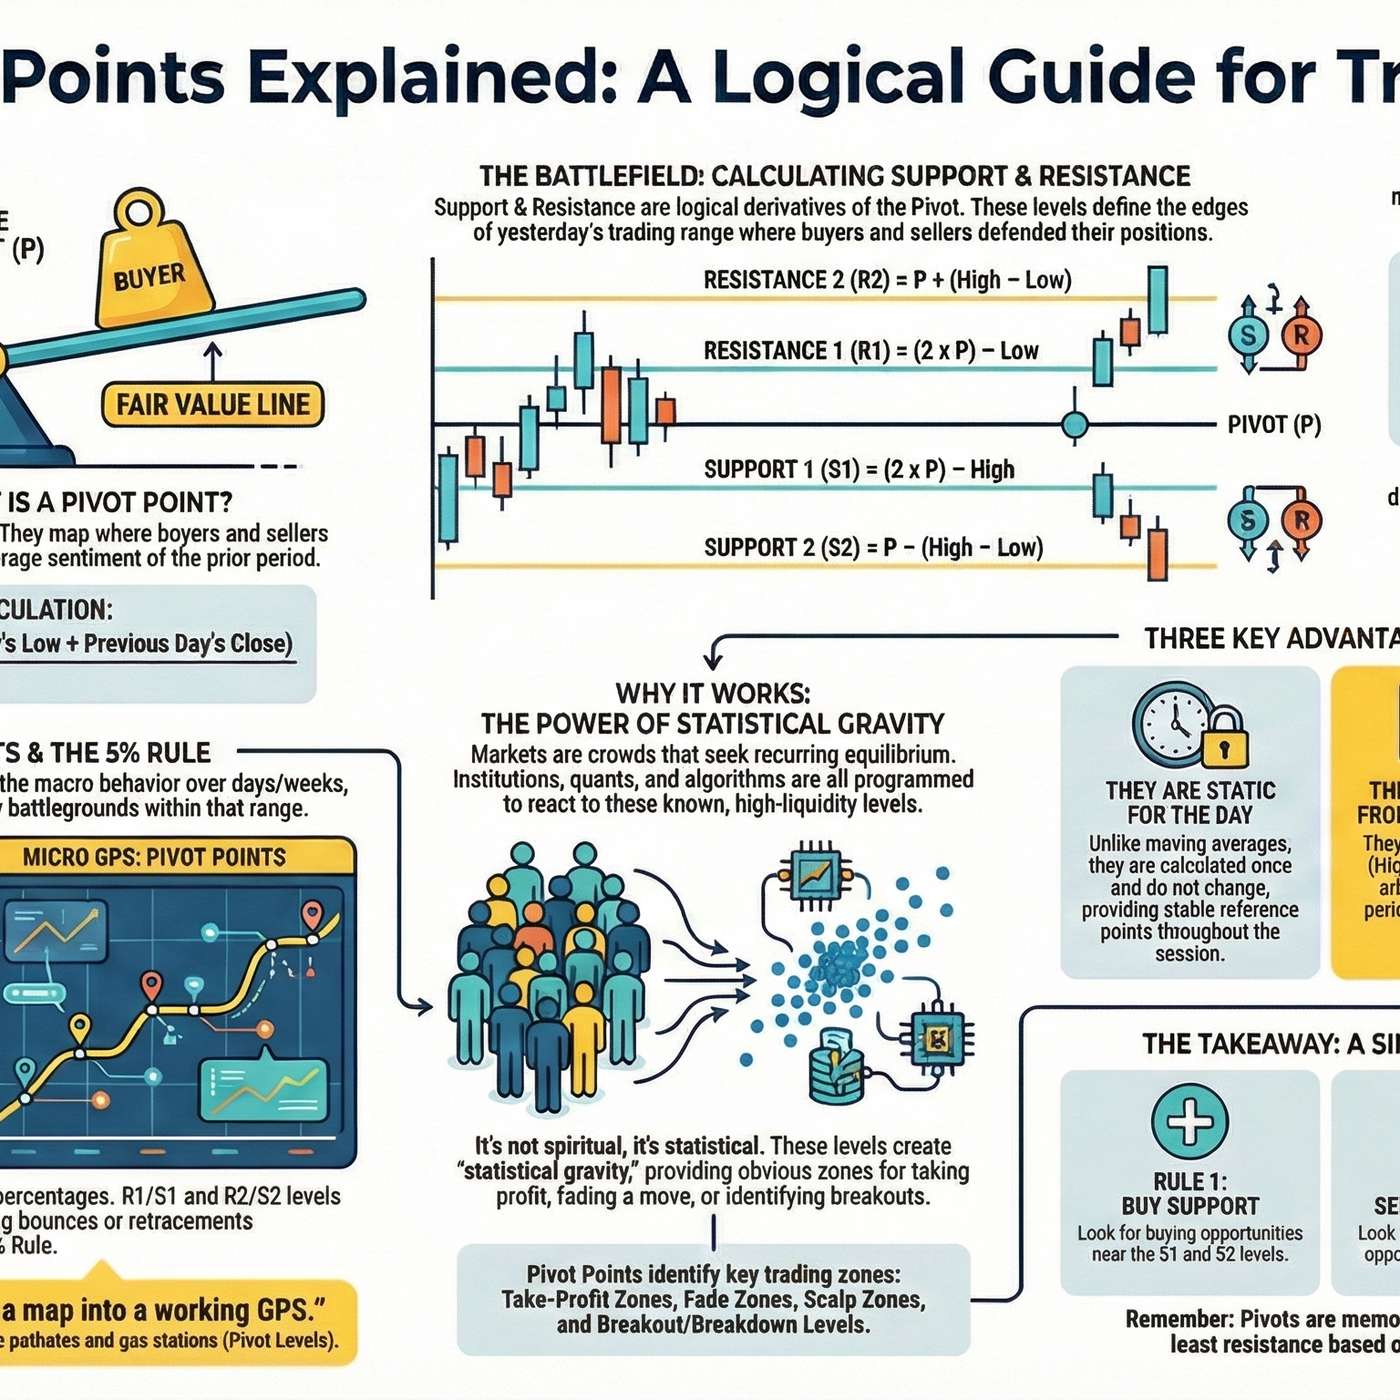
Pivot Point Podcast and the 5% Rule
Description
How Pivot Points Work — And Why They Fit Hand-in-Glove With Our 5% Rule™
Let’s start by clearing the smoke:
Pivot Points are not magic.
They are not predictive.
They are not “telling the future.”
What they are — and why they work — is astonishingly simple:
Pivot Points map where BUYERS and SELLERS previously agreed on value.And humans (and algos) are astonishingly predictable about returning to prior consensus levels.
That’s the whole thing.
Let’s unpack it properly.
1. What a Pivot Point Actually Is
Wall Street defines the Pivot as:
P = (High + Low + Close) / 3It is literally the average sentiment of the prior period.
If you think in PSW language:
The Pivot is the Fair Value Line from yesterday’s battle.Everything else — the support/resistance bands — are just logical derivatives:
R1 = 2P – Low
S1 = 2P – High
R2 = P + (High – Low)
S2 = P – (High – Low)
These levels define:
- Where buyers defended value yesterday
- Where sellers defended value yesterday
- And how wide the battlefield was (the range)
That’s it.
No goat entrails required.
2. Why Pivot Points Work in the Real World
Pivot Points work for the same reason that the 5% Rule™ works:
Markets are crowds, crowds seek equilibrium, and equilibrium tends to recur at mathematically stable levels.Institutions, quants, algos — they're all trained to react to known levels of probability-rich behavior.
Why?
Because if you’re running billions in capital, you don’t “wing it.”
You trade around reliable historical behaviors with enormous liquidity.
Pivot Points give you exactly that:
- Obvious take-profit zones
- Obvious fade zones
- Obvious scalp zones
- Obvious breakout/breakdown levels
It’s not spiritual — it’s statistical gravity.
3. Why They Fit PSW’s 5% Rule So Perfectly
Our 5% Rule states:
Markets move in predictable, fractal ranges based on prior movement.They overshoot by a predictable % (strong and weak bounces) before returning to a stable range.
The 5% Rule defines macro behavior over days/weeks.
Pivot Points define the micro behavior inside those same ranges.
This is the key insight:
Pivot Points subdivide yesterday’s 5% Rule box into intraday battlegrounds.Both tools assume the same human truth:
- Markets don’t instantly reprice
- Supply/demand equilibria persist
- Participants cluster trades around “comfort levels”
- Algos enforce these levels with high-frequency precision
So the Pivot sits right at the centroid of yesterday’s trading — the fulcrum of sentiment — and acts as the natural gravity well.
The R1/S1 and R2/S2 levels line up shockingly well with:
- Weak bounce / weak retrace
- Strong bounce / strong retrace
- Expected overshoots
Which is why you almost always see intraday reversals at these levels.
Not because the market gods ordained them…
…but because buyers and sellers feel the same way today as they did yesterday — unless something truly new enters the picture.
4. Why Pivot Points Are the Best Short-Term Indicator for Non-TA People
Pivot Points have three massive advantages over all the other chart debris:
(A) They are static for the