Episode Details
Back to Episodes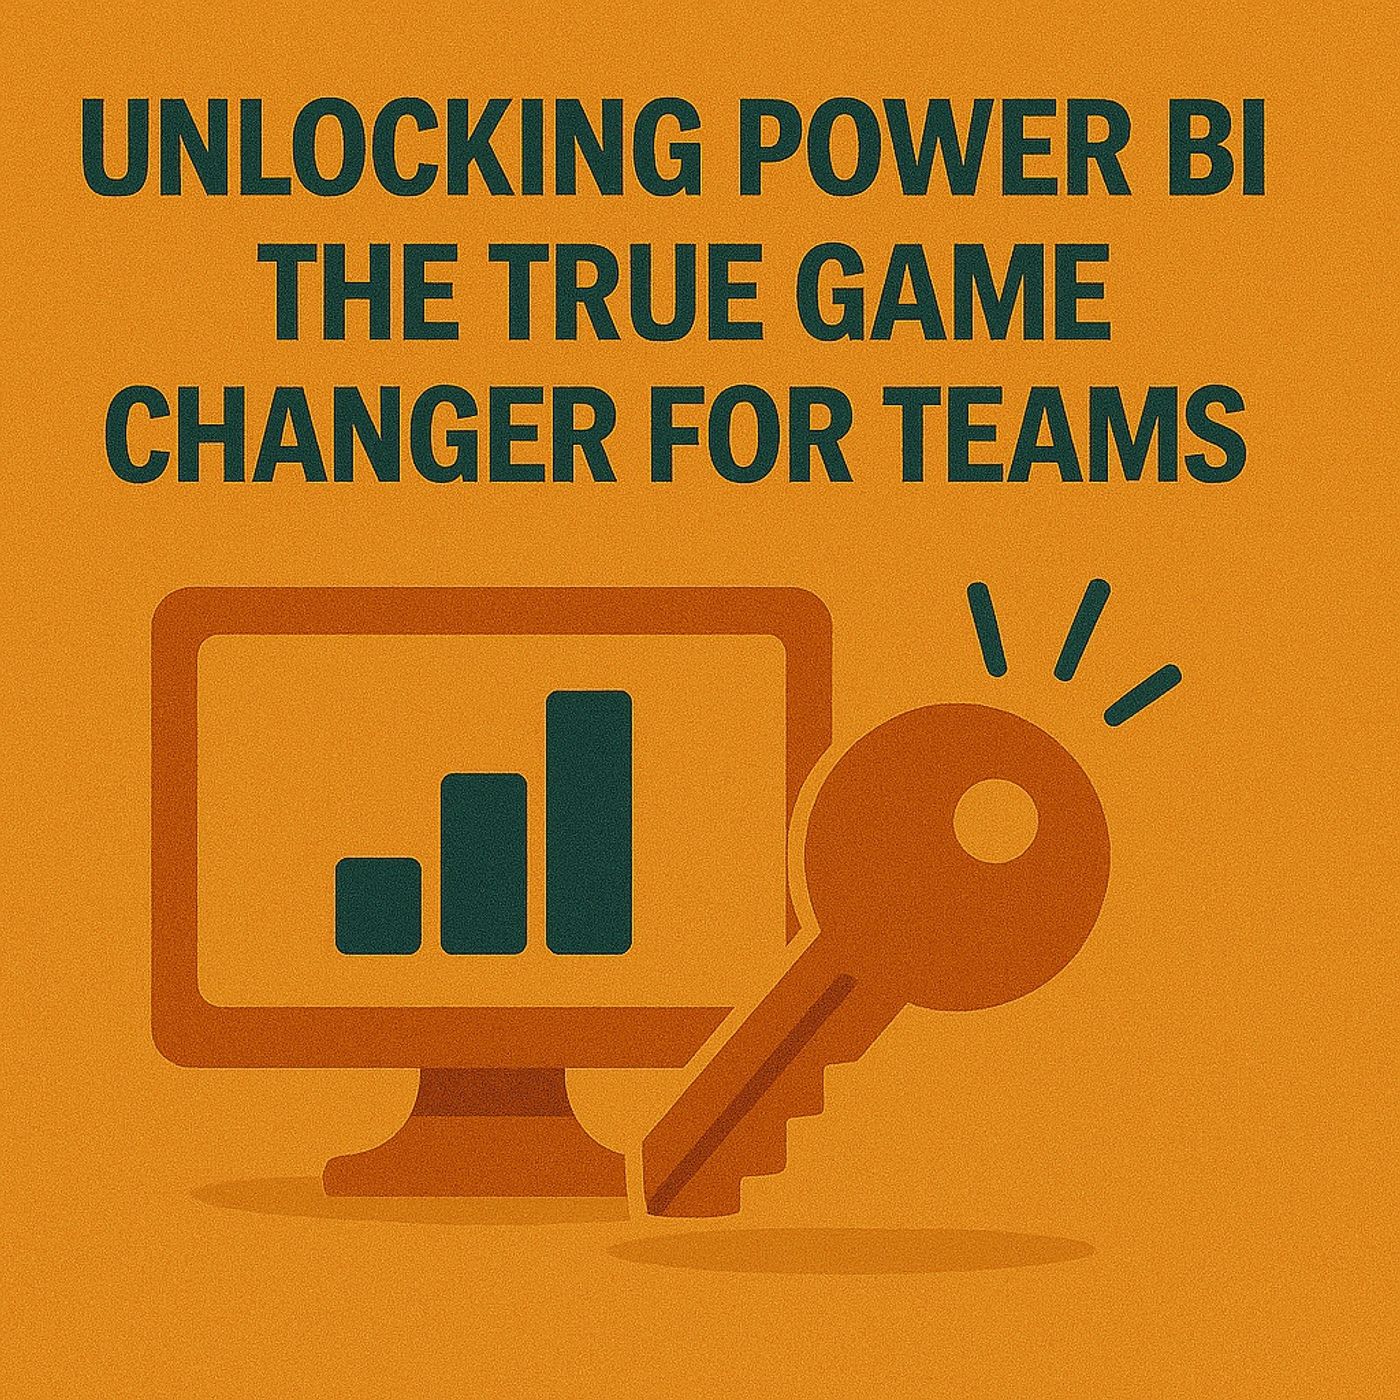
Power BI in Microsoft 365: Embedded Analytics, Fabric & How To Finally Kill Data Silos
Season 1
Published 8 months ago
Description
Power BI in Microsoft 365, embedded analytics in Teams/Excel/PowerPoint/Outlook/SharePoint, context switching, data silos and governance – this episode is for people searching “Power BI in Microsoft 365”, “embedded analytics in Teams”, “connect Excel to Power BI dataset”, “data silos vs Fabric OneLake” or “why intranet reporting fails users”. If your data feels scattered across 47 dungeons and every “final” report has three versions, this conversation shows how Power BI inside Microsoft 365 becomes the legendary weapon that finally unifies your party and your numbers.
We start with the boss fight of scattered data. Departments hoard spreadsheets, dashboards and CRM reports like personal loot; everyone claims to be data‑driven, but in reality they’re reconciling five truths instead of acting on one. You’ll hear how this fragmentation burns hours in “FINAL‑REVISION‑7” loops, how lack of governance and shared definitions erodes trust, and why tools like Microsoft Fabric and OneLake exist to turn disconnected vaults into one consistent data layer rather than just prettier charts on top of chaos.
Then we pull Power BI out of the backpack and into your main hand. Instead of being “that extra portal”, Power BI now lives directly inside Teams, Excel, PowerPoint, Outlook and SharePoint, so live reports show up where conversations and decisions already happen. You’ll learn how Teams channels become shared war rooms around embedded reports, how Excel connects to certified Power BI datasets instead of stale exports, how Outlook and SharePoint host interactive visuals instead of static screenshots, and why killing context switching is the real adoption buff that finally gets non‑BI users to click and explore.
Finally, we dive into the legendary loot: AI‑driven insights and Fabric as the forge. Features like anomaly detection and Copilot‑style summaries help surface outliers and trends so users don’t have to guess which chart to stare at. Under the surface, Fabric with OneLake gives Power BI a unified, governed data armory—structured, unstructured and streaming—backed by governance tools like Microsoft Purview so you don’t just move faster, you keep accuracy, consistency and protection in the loop. The result: less reconciling, more deciding, and collaboration that looks like a co‑op run on one map instead of solo raids on mismatched loot piles.
WHAT YOU WILL LEARN
- Why “data-driven” organizations still drown in scattered spreadsheets and dashboards.
- How Power BI embedded in Teams, Excel, PowerPoint, Outlook and SharePoint kills context switching.
- How shared datasets and live reports replace endless “FINAL-REVISION-7” report versions.
- Why governance and Purview-backed classification are essential to rebuilding data trust.
- How Microsoft Fabric and OneLake unify silos into a single, governed data layer.
Listen Now
Love PodBriefly?
If you like Podbriefly.com, please consider donating to support the ongoing development.
Support Us