Episode Details
Back to Episodes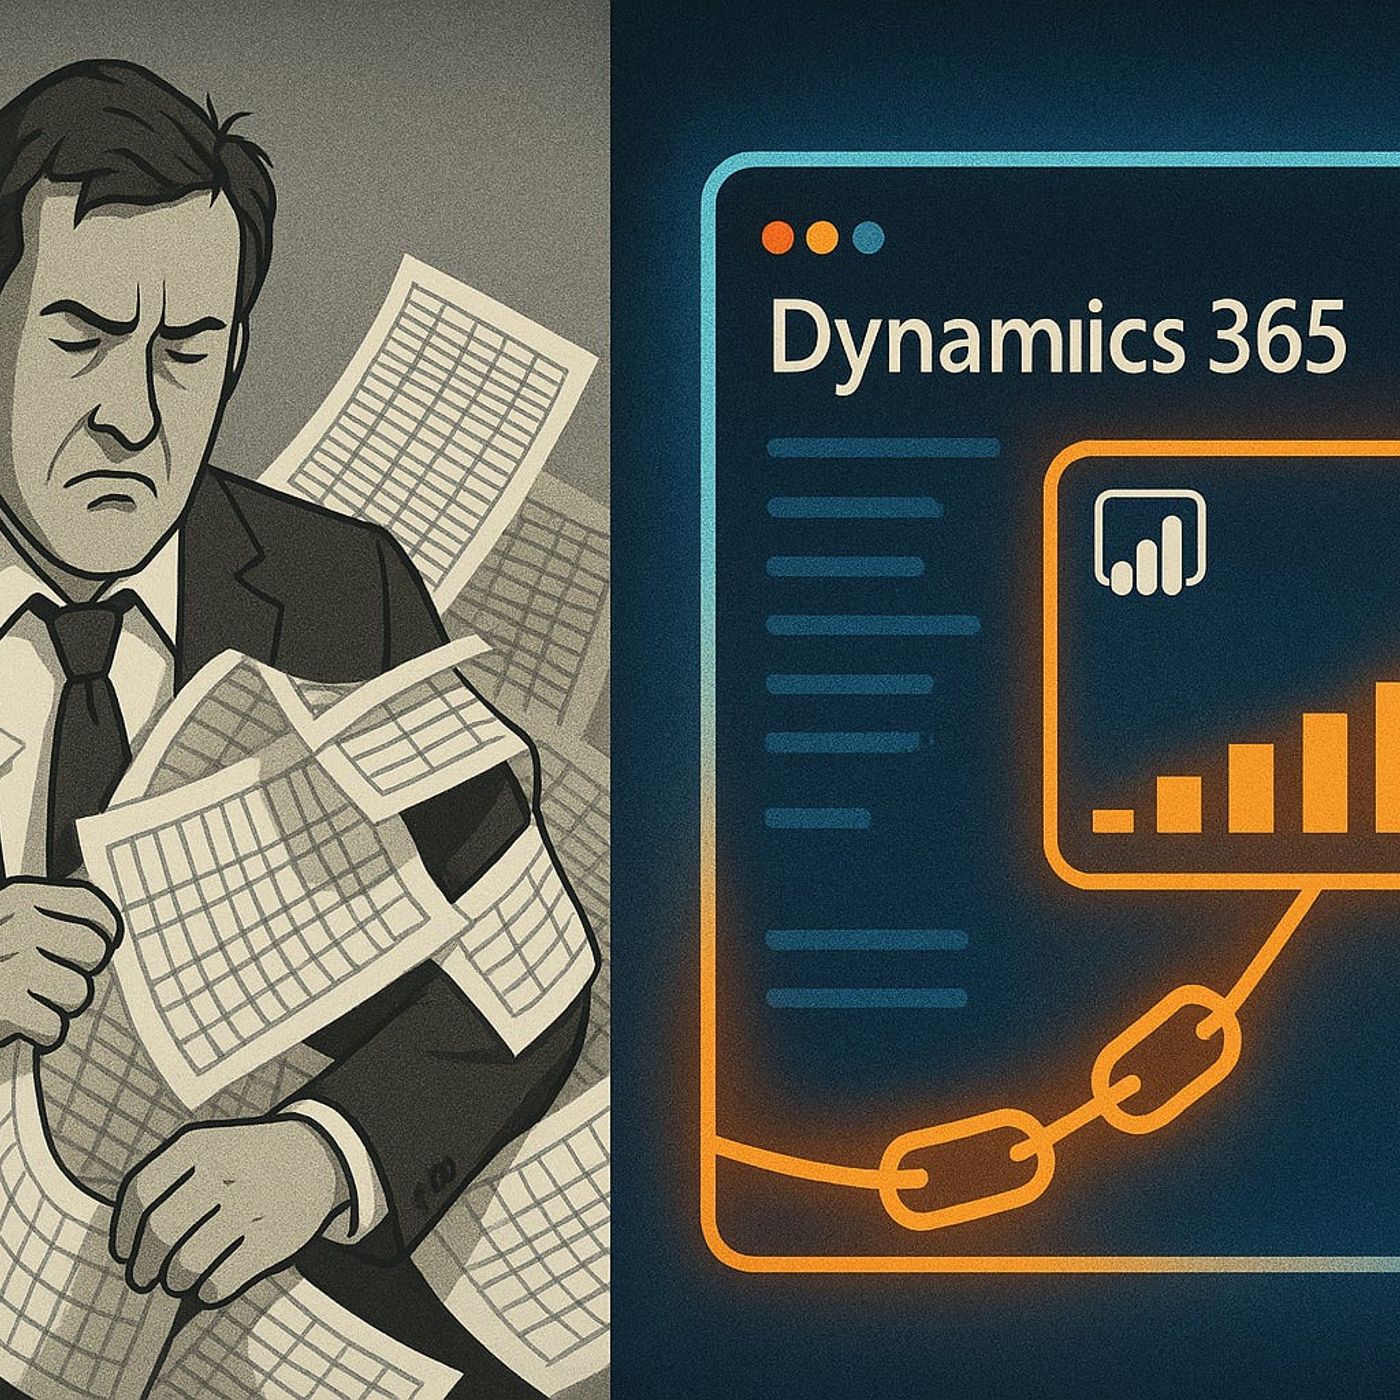
Dynamics 365 Embedded Analytics with Fabric & Power BI: How to Replace Excel Exports with Live, In‑App Dashboards
Season 1
Published 9 months, 3 weeks ago
Description
Dynamics 365 Embedded Analytics with Fabric & Power BI
If you’re still exporting Dynamics 365 data to Excel just to make a chart, you’re burning hours on snapshots that are already stale when the meeting starts. In this episode, I show how to connect Dynamics 365 to Microsoft Fabric, build reusable analytics models, and then embed Power BI directly back into CRM and ERP screens—so sales and operations see live insights in the app they already work in, with no more “final_v3.xlsx” reports.
We start with the Groundhog Day of manual reporting. You’ll recognise the pattern: downloading the same data every morning, reapplying pivot tables, and debating whose spreadsheet is “right” because filters or late updates don’t match. I break down how this export‑driven workflow creates version drift, delays decisions and slowly kills trust in the numbers, even in teams that consider themselves data‑driven.
Then we uncover the missing link between Dynamics 365 and your analytics layer. Dynamics and Dataverse capture transactional events in real time, while Fabric provides a unified, modeled, analytics‑ready copy of that data—alongside finance, supply chain and marketing sources. You’ll hear how Fabric becomes the central nervous system for your data, and how Power BI on top of Fabric can finally give you a single, consistent truth to embed back into Dynamics 365
Finally, we walk through the practical playbook to wire it all together. From enabling a Fabric‑enabled Power BI workspace to connecting Dataverse, shaping the model and embedding reports into Dynamics 365 forms, I outline the concrete steps that turn your current export ritual into a live, in‑app analytics experience. By the end, you’ll know which reports to migrate first, how to keep models stable as your schema evolves, and how to move your teams from spreadsheets on the desktop to real‑time insights inside Dynamics itself.
WHAT YOU’LL LEARN
The core insight of this episode is that reports should be a live extension of your operational system, not a frozen export from yesterday. Once Dynamics 365 writes into Fabric and Fabric feeds embedded Power BI back into Dynamics, your organisation stops arguing over whose spreadsheet is correct and starts acting on a single, always‑current view of the business.
WHO THIS EPISODE IS FOR
If you’re still exporting Dynamics 365 data to Excel just to make a chart, you’re burning hours on snapshots that are already stale when the meeting starts. In this episode, I show how to connect Dynamics 365 to Microsoft Fabric, build reusable analytics models, and then embed Power BI directly back into CRM and ERP screens—so sales and operations see live insights in the app they already work in, with no more “final_v3.xlsx” reports.
We start with the Groundhog Day of manual reporting. You’ll recognise the pattern: downloading the same data every morning, reapplying pivot tables, and debating whose spreadsheet is “right” because filters or late updates don’t match. I break down how this export‑driven workflow creates version drift, delays decisions and slowly kills trust in the numbers, even in teams that consider themselves data‑driven.
Then we uncover the missing link between Dynamics 365 and your analytics layer. Dynamics and Dataverse capture transactional events in real time, while Fabric provides a unified, modeled, analytics‑ready copy of that data—alongside finance, supply chain and marketing sources. You’ll hear how Fabric becomes the central nervous system for your data, and how Power BI on top of Fabric can finally give you a single, consistent truth to embed back into Dynamics 365
Finally, we walk through the practical playbook to wire it all together. From enabling a Fabric‑enabled Power BI workspace to connecting Dataverse, shaping the model and embedding reports into Dynamics 365 forms, I outline the concrete steps that turn your current export ritual into a live, in‑app analytics experience. By the end, you’ll know which reports to migrate first, how to keep models stable as your schema evolves, and how to move your teams from spreadsheets on the desktop to real‑time insights inside Dynamics itself.
WHAT YOU’LL LEARN
- Why export‑driven reporting from Dynamics 365 quietly erodes trust and wastes time.
- How Microsoft Fabric turns Dynamics and Dataverse data into a unified, analytics‑ready layer.
- How to use Power BI on Fabric to deliver embedded, real‑time reports inside Dynamics 365.
- A practical sequence to move from Excel snapshots to live, in‑app analytics for sales and operations teams.
The core insight of this episode is that reports should be a live extension of your operational system, not a frozen export from yesterday. Once Dynamics 365 writes into Fabric and Fabric feeds embedded Power BI back into Dynamics, your organisation stops arguing over whose spreadsheet is correct and starts acting on a single, always‑current view of the business.
WHO THIS EPISODE IS FOR
- Dynamics 365