Episode Details
Back to Episodes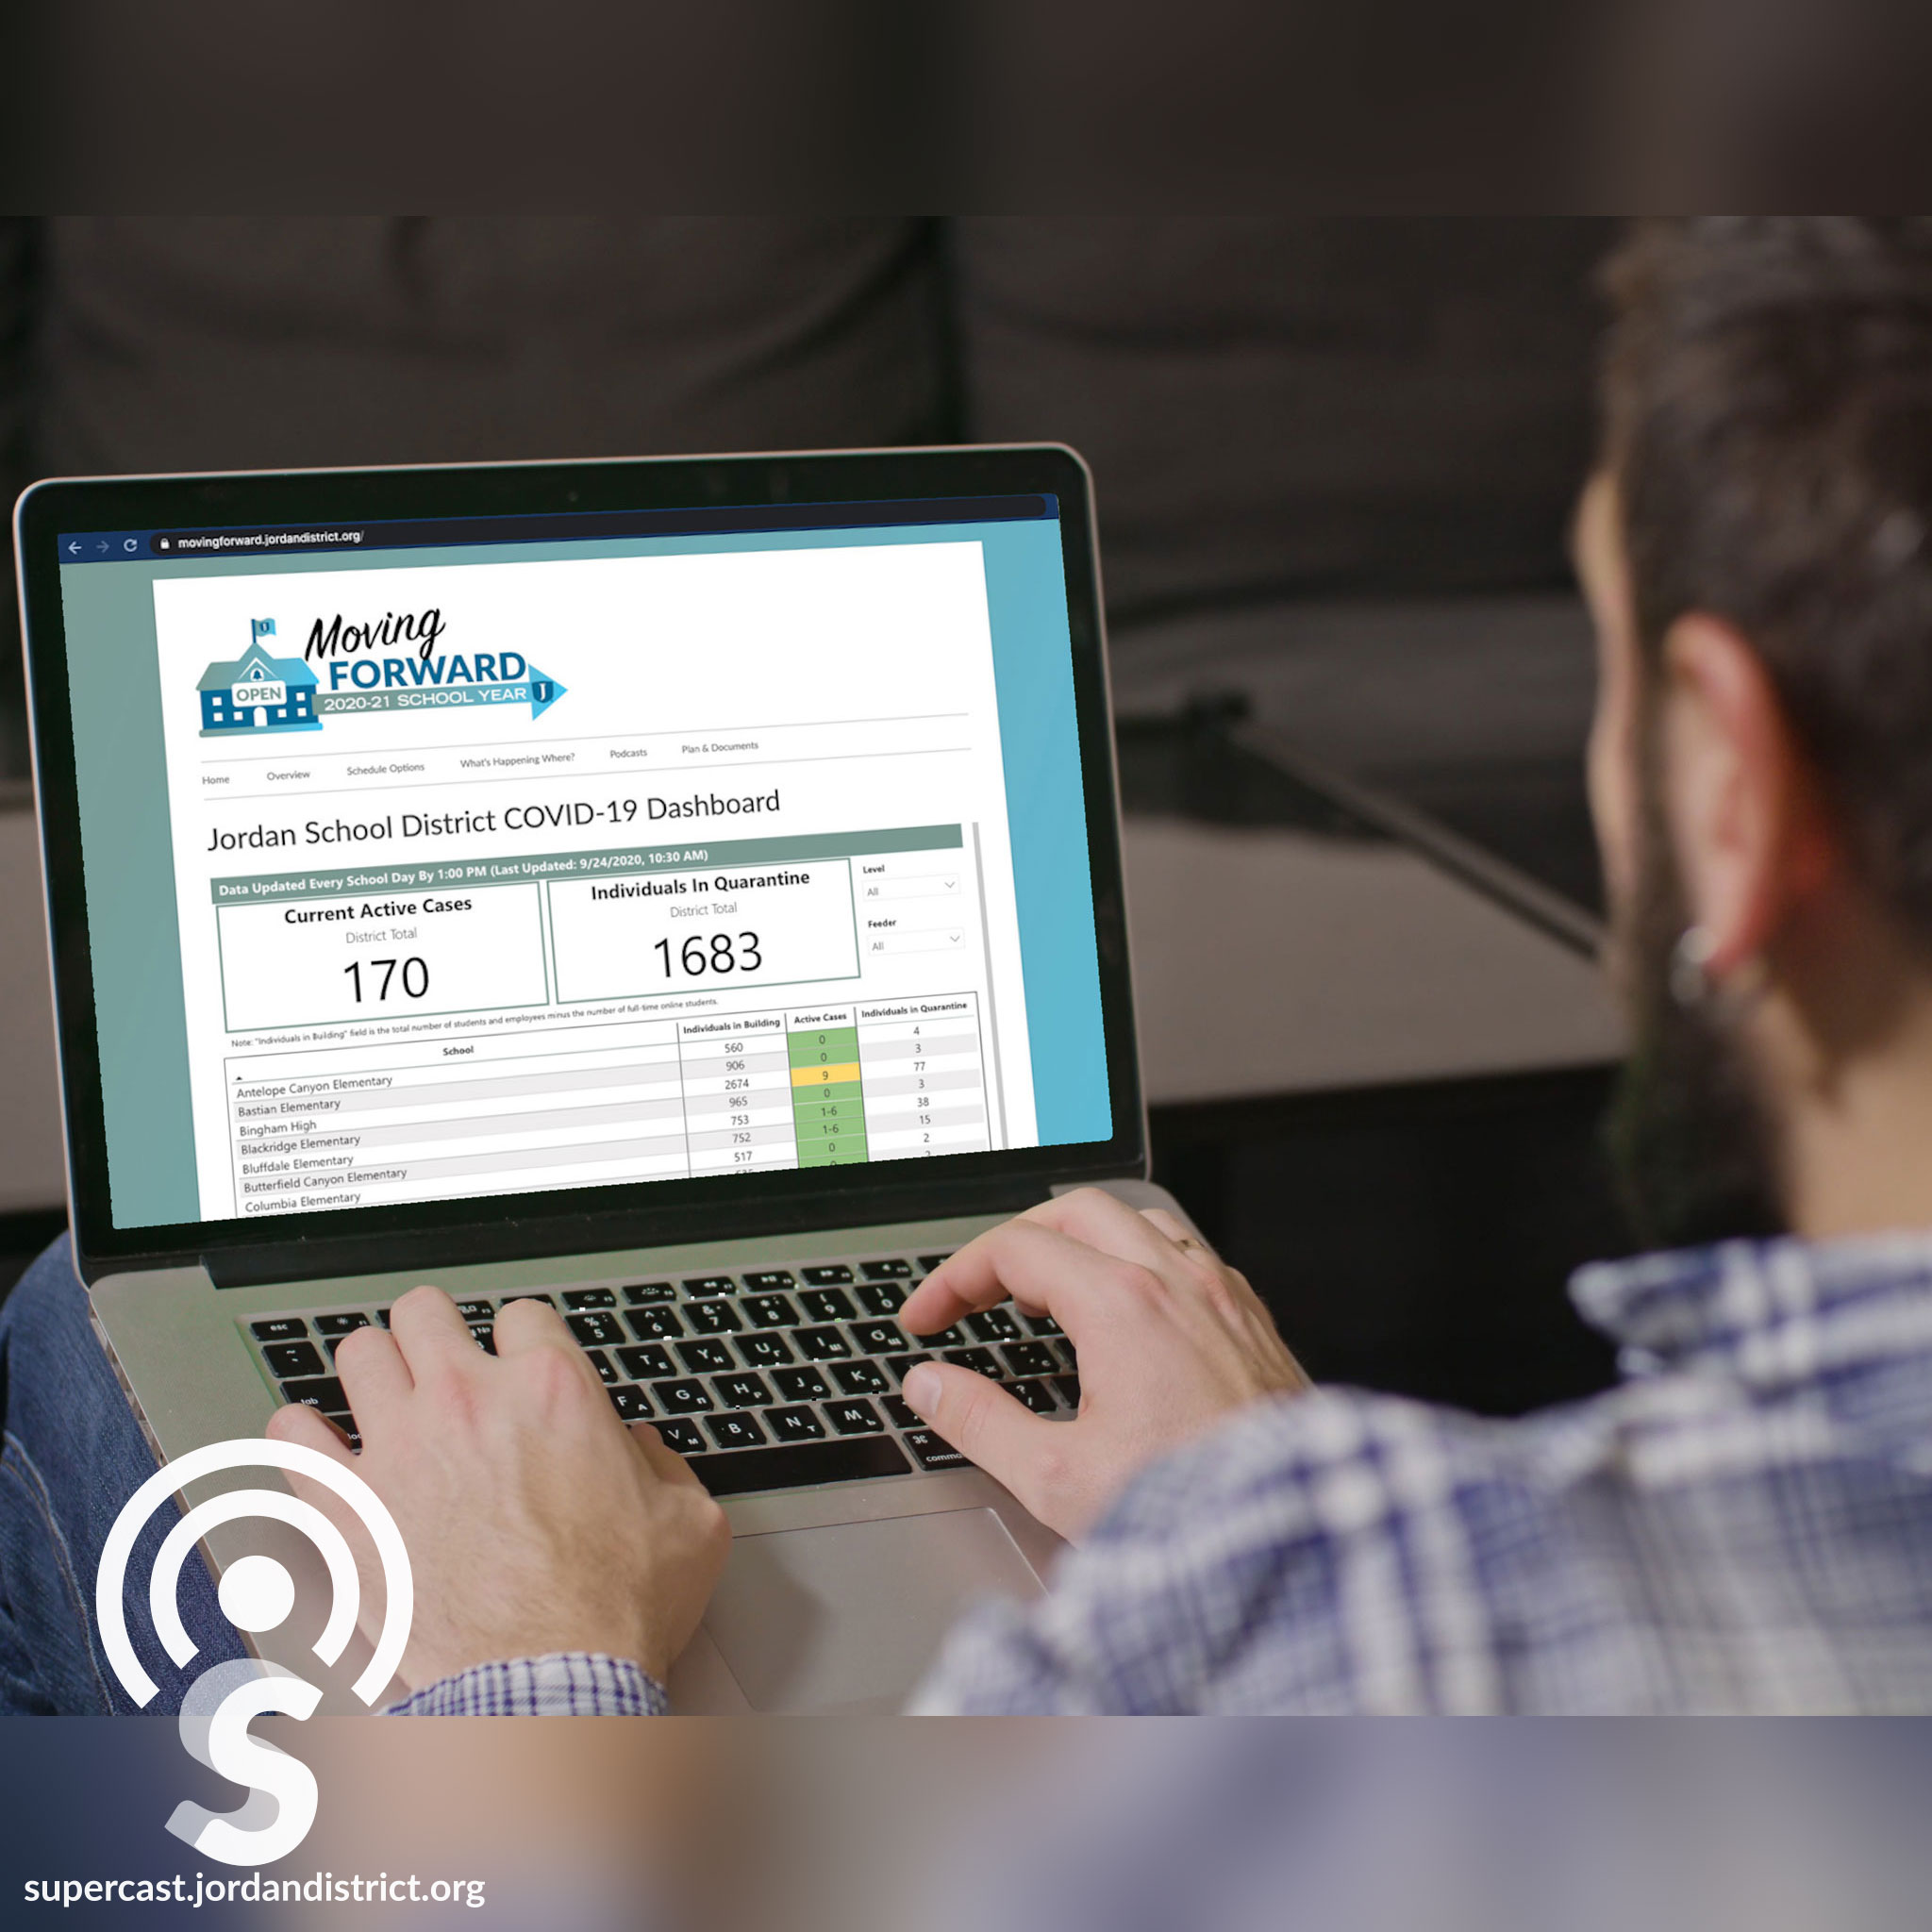
Understanding the Jordan COVID-19 Data Dashboard
Description
Under the direction of the Jordan Board of Education, Jordan School District is launching a COVID-19 Data Dashboard. The Jordan COVID-19 Data Dashboard will update parents and employees on current COVID-19 case counts in every school and office building so they can make the very best decisions for students, families and themselves. On this episode of the Supercast, we explain how the Jordan Data Dashboard works.
The Jordan COVID-19 Data Dashboard can be found at movingforward.jordandistrict.org
Audio Transcription
Superintendent Godfrey:
Welcome to the Supercast. I'm your host, Superintendent Anthony Godfrey. Under the direction of the Jordan Board of Education, Jordan School District is launching a COVID-19 Data Dashboard. The Jordan COVID-19 Data Dashboard will update parents and employees on current COVID-19 case counts in every school and office building so they can make the very best decisions for students, families, and themselves. The dashboard also shows the current number of students and staff in quarantine. Here to talk about the Jordan Data Dashboard and how it works is our Associate Superintendent, Mike Anderson and Planning and Enrollment Consultant, Caleb Olson. Thanks for joining me today. Most contracts in the District include the phrase, “other duties as assigned”, and this Data Dashboard falls under that category for you because you're someone who's skilled at just doing a lot of different things and pulling numbers together in a meaningful way. Caleb works with our enrollment numbers and our permits and works behind the scenes just to make all of that make sense for our schools, providing data districtwide. And so, I really appreciate your work on the Data Dashboard. I have it here in front of me and we've sent, along with the link to this podcast, a link to every parent and employee so they can access this. Can you just kind of walk me through the information that's included here on the dashboard?
Caleb Olson:
Yes. So, on the Dashboard at the top, where it's most visible and easiest to see, we have a total of the current positive COVID-19 cases in the District. And then we show a number that is the number of individuals districtwide in quarantine at the moment. Underneath that, you can see those same figures for each of our schools and the different work locations. When you go into the table at the bottom, it has a number that is the number of individuals in the building. And that number is the number of people that would be in that building or that location every day. It includes all of the students and all of the employees. Then we subtract out the number of full time, online students who don't come into school.
Superintendent Godfrey:
And the reason for reporting that number is that on Tuesday night, the Board decided that at certain percentage levels, certain things would happen at schools in response to an increase in the number of cases. So that number allows us to quickly see when we're approaching those percentage points.
Caleb Olson:
Exactly. We have that available so that any employee or any parent or any student can come and find their school and see what the situation is, what the case count is like at their building. There's also the ability to look at your feeder system, your area of the District, or to look at different levels of the district. You could see the totals for all of the elementary schools or the middle schools to kind of get that higher-level picture, if that's something you're interested in. Hopefully it's set up in a way that makes sense to our parents and our students and our employees so they can get the information they need to be informed when they make their decisions.
Superintendent Godfrey:
I know that with the County Data Dashboard, there are a lot of people hitting refresh throughout the