Episode Details
Back to Episodes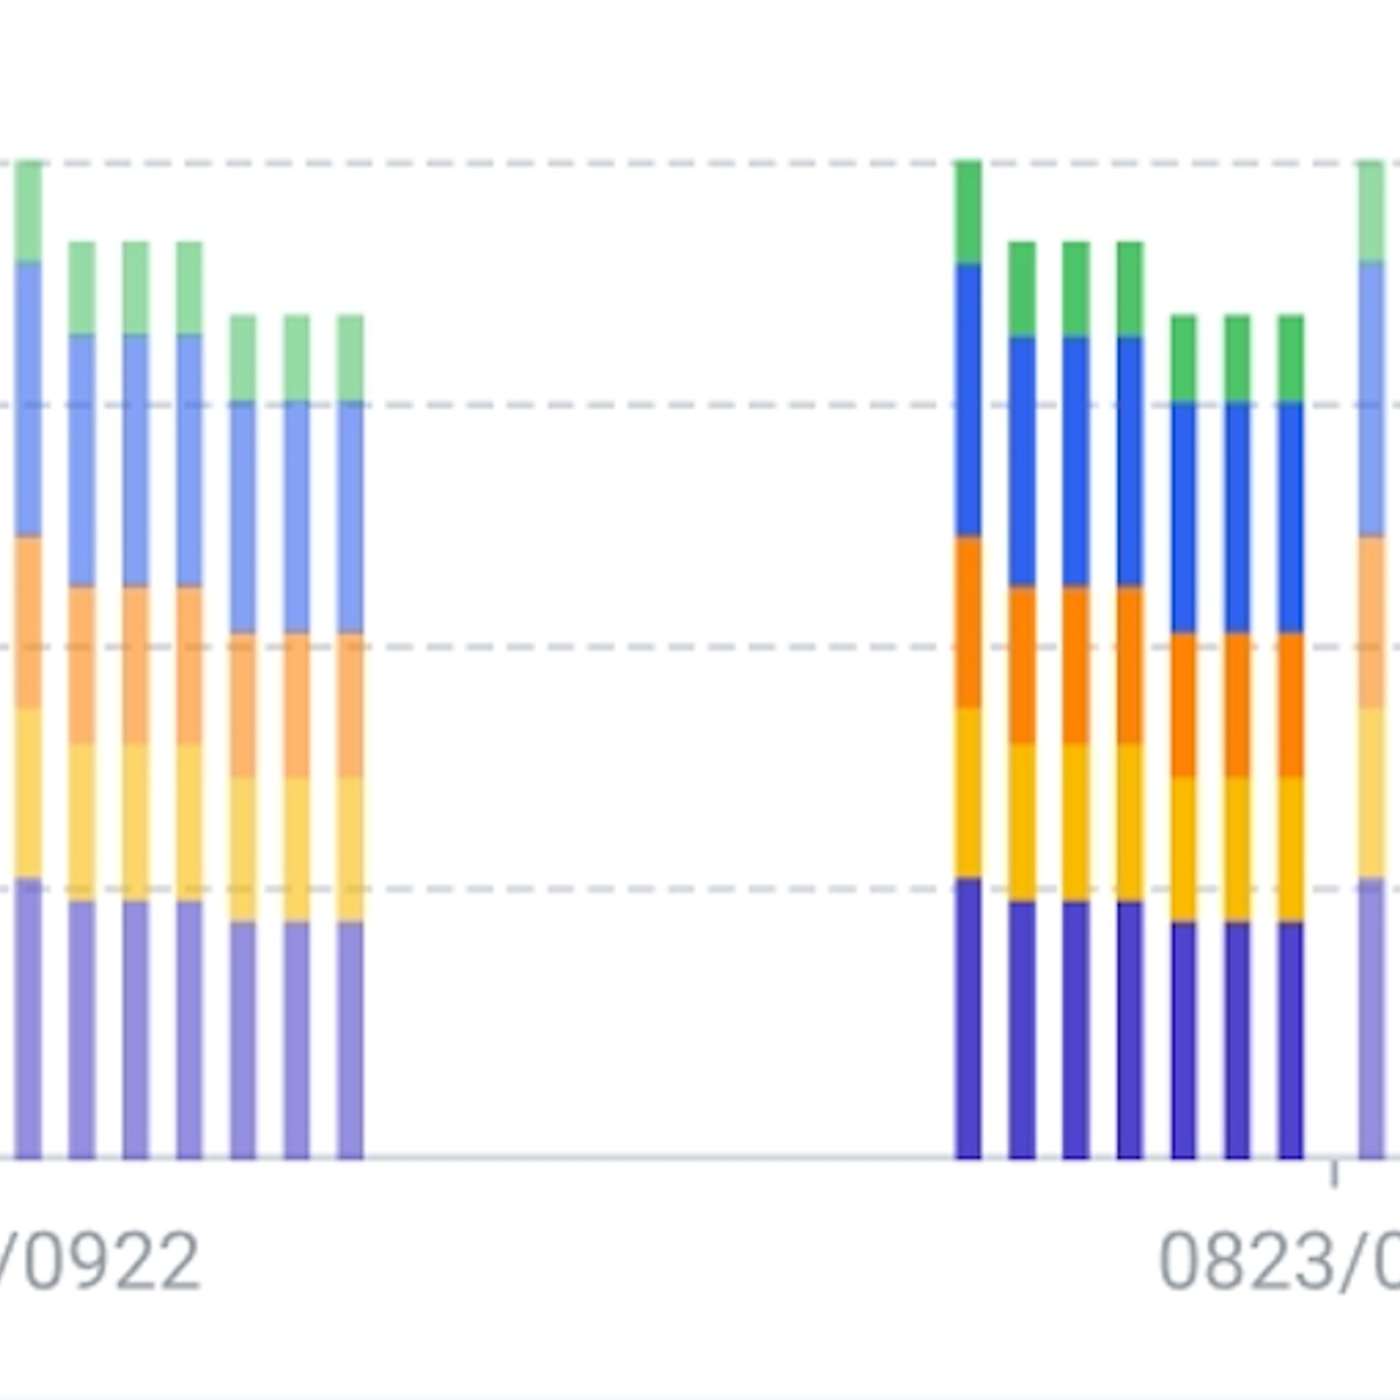
How to Implement Multi-Group Bar Chart and Interact With Highlighting by Grouping Dimension
Description
This story was originally published on HackerNoon at: https://hackernoon.com/how-to-implement-multi-group-bar-chart-and-interact-with-highlighting-by-grouping-dimension.
Solution for implementing a multi-group bar chart similar to the following figure:
Expect two groups to differentiate in style through color transparency.
Check more stories related to data-science at: https://hackernoon.com/c/data-science.
You can also check exclusive content about #visualization, #visactor, #vchart, #multi-group-bar-chart, #grouping-dimensions, #data-science-guide, #vchart-guide, #vchart-tutorial, and more.
This story was written by: @hacker5022841. Learn more about this writer by checking @hacker5022841's about page,
and for more stories, please visit hackernoon.com.
Solution for implementing a multi-group bar chart similar to the following figure:
Expect two groups to differentiate in style through color transparency.
When the mouse hovers over a column block, all blocks of the same color are highlighted in linkage.