Episode Details
Back to EpisodesFocusing on rental income could cost you $1m in lost wealth
Description
An investment property’s total investment return will consist of rental income plus capital growth. I have written about the importance of maximising capital growth many times. However, often investors are tempted to focus attention on income (when selecting an investment property) too, as they seek to minimise the cash flow cost of holding the investment property.
I propose that this is a mistake with a high opportunity cost. The reason investors make this mistake could be due to (1) not fully appreciating the consequences of their decision, (2) need to adjust their target property attributes or (3) need to reduce their investment budget.
Focusing on income means you must spend more on the building value
The value of a property consists of two components being the land plus any improvements i.e., the dwelling. Generally, land appreciates in value whereas buildings depreciate over time due to wear and tear, which I have written about here.
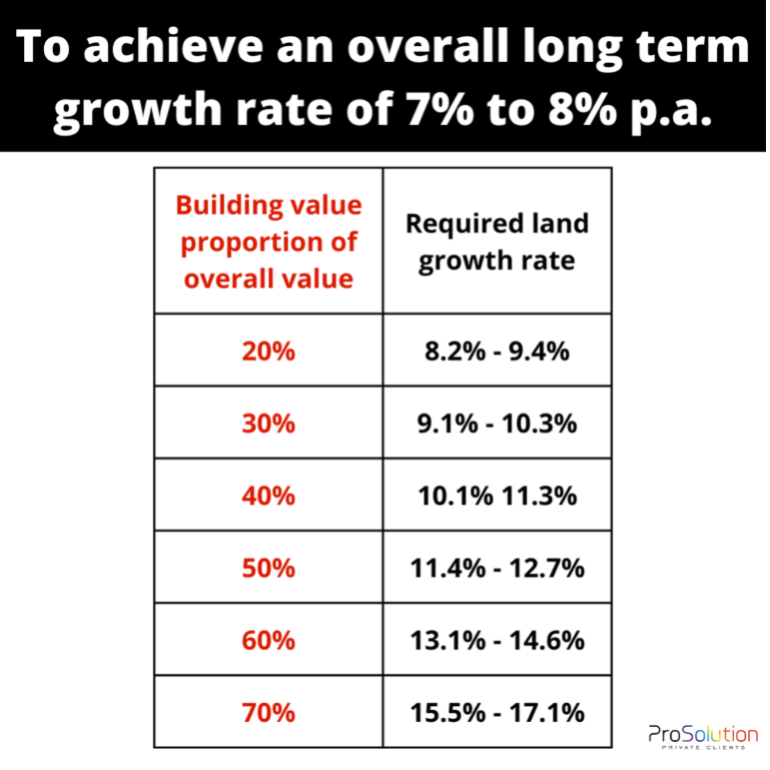
The table below illustrates this point. If you aim to achieve an overall capital growth rate of 7% p.a. to 8% p.a., which is a reasonable expectation for an investment grade property, then the more you spend on the building value, the greater the rate of land value appreciation you will need to achieve an overall rate of growth of 7-8% p.a.
TABLE
In summary, investors should focus on land value whereas tenants focus on the quality the dwelling.
Opportunity cost of focusing on income
It us unrealistic to expect an investment property to return more than 10% p.a. in total over a long period of time. That is, the gross rental yield plus capital growth rate cannot exceed 10% p.a. Typically, properties that offer higher rental yields will almost always deliver lower growth. This makes sense given the building value drives income but not capital growth.
Therefore, an investor can manipulate the makeup of their return (i.e., how much income and growth they may receive) by targeting different types of property.
The chart below compares the wealth impact of various combinations of income and growth. At the extreme (left-hand si